Bad day yesterday.
I was mainly taking shorts but lost over 20 ES points! ouch!
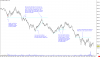
arrowss entry (green long, red short) dots are exits
I'm getting in late here, but I just wanted to show how I would view this. Keep in mind, its all hindsight, and keep in mind I don't really look at the ES, just the NQ, so this is almost more of an exercise for me than anything else.
One of the big things I have come to realize is that context is what separates the men from the boys. Figuring out what levels matter and which ones don't is important. Figuring out what lower high is significant and which one isn't is also important.
I personally don't like diagonal trendlines so much because they can be drawn in so many different ways, but they do work well every now and then. The thing though is that if I'm gonna control risk, I want to get in at the trendline, not above it after I might think I have some confirmation of a lower high or what have you, and if I'm expecting price to act a certain way at a trendline, if it doesn't, its time to bail. The closer I can get in to the trendline, the tighter my stop can be. Plus, a few of your trendlines are kind of in between extreme areas, so you're trading in the middle where its a bit choppy.
I made a few notes onto this chart here based on your chart. So first, at the end of the day, you mark a great short you took based on what looks to be a case of support then resistance, in fact, you took this trade twice.. two great shorts. But this exact same thing happened earlier in the day where I mark my support line I would draw from the opening low that was put in just after the open. When we break through and come back up again, we have lots of difficultly. 2 hours later, once again, we cannot cross.
Also on your chart, you mark a trendline break trade. The first is a winner, but the second is a loser. I mark why I think the second doesn't work... the area just before started to show support with the previous swing lows that just weren't dropping lower.
But I also mark another trendline that provides a great short when it breaks, but you don't have this on your chart. When you actually start to skip some trendline break trades, you might be skipping the winners and only taking the losers, thereby totally messing with what could actually be a profitable statistical edge. More importantly also, this trendline follows price up to the area I already marked as a level to watch, so when this trendline broke, you have not only your regular trendline break, but you have price not being able to go above a previous level that was support then resistance.
Anyway... I'm just an amateur, but I wanted to share what jumped out at me.