"My Edge"
Part 2
6)
Cumulative Delta
I took a course on "Footprint" charts. I even showed some in my last journal. All the limit orders in the world don't move the markets. Someone has to take the leap. Therefore, all the numbers of the deals transacted at the ask or the bid represent the "aggression" to the upside or the downside.
Footprint charts were fascinating, but in fast moving markets, there is no time for numbers! So I shrunk them down and got simple colored bars for bullish or bearish or neutral activity. But even those were just "one more thing to look at."
Then I stumbled upon Cumulative Delta charts, which simply moves a line up or down based on the aggression of the market participants. Here is a short tutorial:
https://www.jigsawtrading.com/learn-to-trade-free-order-flow-analysis-lessons-lesson8/
The On Balance Volume (OBV) indicator is very similar.
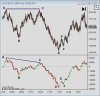
Things get almost magical when I do an overlays on my charts: (Teal is the OBV in this case.)
What do you see? The teal line is going down. This demonstrates that more volume is hitting the bid than the ask. The "aggression" is down. And what is price doing? It is going down.
In my two years of using this, I have seen an accuracy rate of about 70%. If the CD or OBV is going DOWN, will the market go down? About 70% of the time! Them's good bettin' odds folks!
BUT I don't just following the CD/OBV line around all day long. I need actual signals on the price. So I use the CD/OBV more as a filter against bad trades. If the CD/OBV is pointing down, I will NOT go long! But I will consider shorts. So more than anything, it keeps me SAFE.
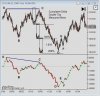
Most of the time, the lines are synchronized well. But sometime there is a big divergence, and that is when I really pay attention. And I use it on multiple timeframes. Here is an example of a two-day view on YM and NQ:
When I see these two charts I say "Be careful. The market is mixed. The YM has been down, but the behind the scenes action (CD) is bullish. The NQ is up, but the CD has not been rising." When multiple instruments are in sync, then good moves often result.
Have fun with the Cumulative Delta or OBV. I know I do.
7)
VWAP. Volume Weighted Average Price. I don't want to get into the details of how this is calculated, but once I heard that the hedge funds watch this, I was hooked. It is good to know if it is rising or falling, but the true value comes in the (1) Standard Deviation
bands. They are amazing at predicting turns. The other important concept is (2) that the
VWAP acts as a magnet, kind of like the midline in the range conditions I previously mentioned.
Here is today's chart. Notice the red arrows at the orange +1 SD band and at the green arrows at the orange -1 SD band. This is where the RTM (reversion to the mean) action is the strongest, with the VWAP (red) as the target.
Above +1 SD and below -1 SD, the action is really tricky. I may discuss my observations later another time if someone is interested.
That's all for today. In my next installment:
8) Entering in a pullback
9) Break of Two
10) Volume Profile: Value Area and Point of Control