Thanks, xioxx. Besides the fact that your annotations look very clean compared to mine, I see several important differences between our charts.
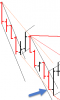
- You drew your LTL from the 2nd bottom (13:40) whereas I drew mine from the 1st bottom. I agree with you.
- At the arrow you show a bar that spans the container and I would have seen as not a VE ITZ. It’s close, but I think you are correct again.
- Where I am not yet persuaded is that the retrace beginning at 14:15 is equal weight with the BBT1 to that point in time. So I see BBT1 continuing after 14:35, rather than being promoted to a tape. Therefore I don’t see how things are much changed going forward.
- You show a larger container, a tape, starting at 13:50. I don’t understand why the tape, if you saw it as such, wouldn’t start back at 13:10.
- As to the sloppiness, my lines themselves drifted from their original position, which is very sloppy. Also I retain my original FC and BBT trend lines even after the trend lines have been fanned or accelerated. This creates clutter and a sloppy impression. I’m not sure whether it is incorrect to do so, however.
I also have a question about the OB at 14:15: would you consider that a b2b within that retrace? If so, the retrace is a full volume cycle, but even so doesn’t appear to me to be EW with BBT1.