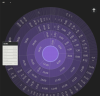
At some point, I'd like to get it to this type of real-time visualization
View attachment 342866
https://moebio.com/mind/
My current implementation is based on the 10 cases of price ala Jack Hershey
This is just the price component which hasn't been mapped to time yet nor volume
It just calculates the probabilities of the next case of a price case as one builds bar strings.
What has emerged from the tool is that as one goes to higher timeframes the market roughly is up 1/3, down 1/3 and ranges 1/3. It's only as one drills down where directional probabilities begin to stack and expose edge.
View attachment 342867
It's in exploratory mode, where the string of cases: XB -> OB -> OB has as the next price case be an XB with 36% probability. The strings can be extended to create a 'map' of monthly and weekly profiles based on historical data.
The goal going fully automated but my coding skillz aren't as developed and I'm bumping up against the limitations of pinescript's token and memory allocations.