Hi everyone,
The latest Commitments of Traders review is out.
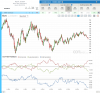
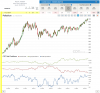
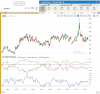
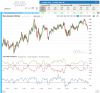
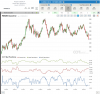
RBOB Gasoline
COT Change (52W) / C â 28%, LS â 28%, SS â 22% /
The change in Traders positions was significant, we can talk about a cot change signal. It is bullish and looking at the last one year, we can see that in the majority of cases, these signals could effectively be used.
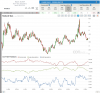
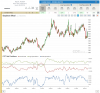
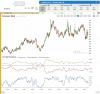
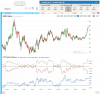
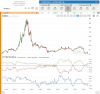
Soybeans
COT Extreme / C â 429, LS â 226 report, SS â All Time COT extreme /
The cot extreme is becoming larger and larger. It is of course extremely difficult to tell, when the decline will end, but it is pretty clear that stresses in this market will soon burst and eventually create a bottom.
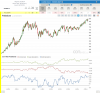
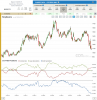
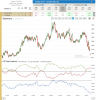
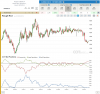
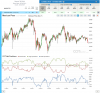
Silver
COT Extreme / C â 196, LS â 198 report COT extreme /
Not too long ago we were talking about a bullish cot extreme, but as you can see, things can change pretty fast in the market ï we are now seeing a bearish extreme. This is a warning for those of you, who took the bullish signal earlier and built up a long position.
All the best,
Dunstan
the original COT report
COT charts
The latest Commitments of Traders review is out.
RBOB Gasoline
COT Change (52W) / C â 28%, LS â 28%, SS â 22% /
The change in Traders positions was significant, we can talk about a cot change signal. It is bullish and looking at the last one year, we can see that in the majority of cases, these signals could effectively be used.
Soybeans
COT Extreme / C â 429, LS â 226 report, SS â All Time COT extreme /
The cot extreme is becoming larger and larger. It is of course extremely difficult to tell, when the decline will end, but it is pretty clear that stresses in this market will soon burst and eventually create a bottom.
Silver
COT Extreme / C â 196, LS â 198 report COT extreme /
Not too long ago we were talking about a bullish cot extreme, but as you can see, things can change pretty fast in the market ï we are now seeing a bearish extreme. This is a warning for those of you, who took the bullish signal earlier and built up a long position.
All the best,
Dunstan
the original COT report
COT charts
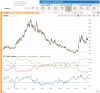
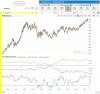
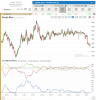
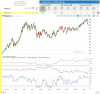
") The pictures says it all!! (unquestionable large cot buy signal)
The pictures says it all!! (unquestionable large cot buy signal)