Hi all,
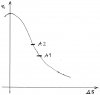
Let's assume that a certain aspect of the price movement is a random distribution process. We plot two points on the distribution curve that are not too far apart, plug in two sensors at the points and take readings. If the points are not too far apart, the curve is nearly linear, so the readings are proportional and can be normalized to look identical.
Because the two points on the distribution curve correspond to different probabilities, one of them is "stronger" than the other.
The weaker reading is plotted on top and the stronger at the bottom.
If the upper curve A1 moves up and the lower curve A2 does not confirm the move, there is an anomaly in the price movement and it will move toward the stronger lower curve. And vice versa for down moves.
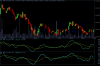
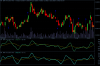
Attached are 1 minute YM charts for the last trading session of 27 Jan. 2017. The anomalies are clearly visible.
What do you think?
Let's assume that a certain aspect of the price movement is a random distribution process. We plot two points on the distribution curve that are not too far apart, plug in two sensors at the points and take readings. If the points are not too far apart, the curve is nearly linear, so the readings are proportional and can be normalized to look identical.
Because the two points on the distribution curve correspond to different probabilities, one of them is "stronger" than the other.
The weaker reading is plotted on top and the stronger at the bottom.
If the upper curve A1 moves up and the lower curve A2 does not confirm the move, there is an anomaly in the price movement and it will move toward the stronger lower curve. And vice versa for down moves.
Attached are 1 minute YM charts for the last trading session of 27 Jan. 2017. The anomalies are clearly visible.
What do you think?