
Fibonacci works due to self fufilling prophecy or becuz 618 is embeded in humans?

K, so it's the Mandelbrot method? I'm a beginner to Fib's as applied to the markets and trading.

Fractals though, are another matter. They are very applicable to the markets and trading.

Perhaps someone with more advanced knowledge of various fibonacci's tools and their application could talk through a typical "take the trade!" moment.

I don't understand why one tool would be more applicable in different contexts nor how to properly use any of the tools.

Maybe
@peter2h
@MACD
would be kind enough to post a chart with a typical tool and what they are thinking as they put on a trade.

Hi Sprout,
I'm not interested much in the theory behind Fibonacci, or Mandelbrot. And everyone probably has a favorite tool about which they have learned all the ins and outs. It's not necessarily that I'm anti-intellectual, only that I found that the Fibonacci products are the best for me. I'll display a chart along with what I was doing.[ATT
2018-12-20-TOS_CHARTS.png
ACH=full]196283[/ATTACH] View attachment 196283 View attachment 196283 View attachment 196283 View attachment 196283 View attachment 196283
It takes a lot of trust, or courage, to consider buying when prices are falling. But if you trust the fibs, and know how to use them, one can get past those problems.

On this day, just about a week ago, the market opened a tiny bit down from the previous day. The trader has to expect a small move down then up. The thing is that each time the bar is formed it seems to have stopped--or closed--right upon one of the fib lines. We can be encouraged by the Stochastic that prices are high in their range and more likely to come than go down. Nor in the following decline does a bar (5 min.) not at least tip its hat to each fib line that it goes though. I see the overnight low (red line)coming and wonder if it will stop there as it very often does, but I see that it's aiming for the pivot (green dots), another important number. And I see too that the 127% is right there at the pivot. There are always counter trend orders around the pivot. A bounce is due from those two: the pivot and the 127% fibonacci level. It's hard to believe until you see prices stop at it and decide to go the other way. Well you can see that I look for possibilities at or around the fib levels, with confirmation from the Stochastic being wise.
 
...Well you can see that I look for possibilities at or around the fib levels, with confirmation from the Stochastic being wise.

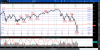
So what does all your analysis say your next definitive trade should be, using the fib and stochastic?
 
So what does all your analysis say your next definitive trade should be, using the fib and stochastic?

I don't pay as much attention to the future as a swing trader would so this chart is just a theoretical endeavor. If I were a swing trader I think I would use something like this which gives some idea of what might happen. It depends on the confluence of the two major variables: the fibs and the stochastic.
 

Attachments

  • 2018-12-29-TOS_CHARTS2.png
    2018-12-29-TOS_CHARTS2.png
    112.6 KB · Views: 25
I don't pay as much attention to the future as a swing trader would so this chart is just a theoretical endeavor. If I were a swing trader I think I would use something like this which gives some idea of what might happen. It depends on the confluence of the two major variables: the fibs and the stochastic.

You didn't answer my question. Using your analysis, what would your next entry be? Doesn't matter if you are position, swing, day or scalper. What does that chart show you that your next entry will be?

... It's not necessarily that I'm anti-intellectual, only that I found that the Fibonacci products are the best for me.

They are best for you in what way? To make a trading decision?
 
I don't pay as much attention to the future as a swing trader would so this chart is just a theoretical endeavor. If I were a swing trader I think I would use something like this which gives some idea of what might happen. It depends on the confluence of the two major variables: the fibs and the stochastic.
Do you actually think that there is a trading setup on that chart? I believe that trading involves a lot of waiting, whether it's daily or one minute chart. This is a waiting chart.
 
You didn't answer my question. Using your analysis, what would your next entry be? Doesn't matter if you are position, swing, day or scalper. What does that chart show you that your next entry will be?


They are best for you in what way? To make a trading decision?
what else?
 
Back
Top