
Fake Science creates a fake consensus.
Real science shows that co2 levels trail change in ocean and sea temps.
Here we see one of the myraid ways we can see it.
For... brain blocked agw nutters... let me use colors to explain...
The blue area leads the green area. The red shows the diff... or the lead.
When you break down the data you see sea temp lead co2 by a year
Air temp lead by 9 months.
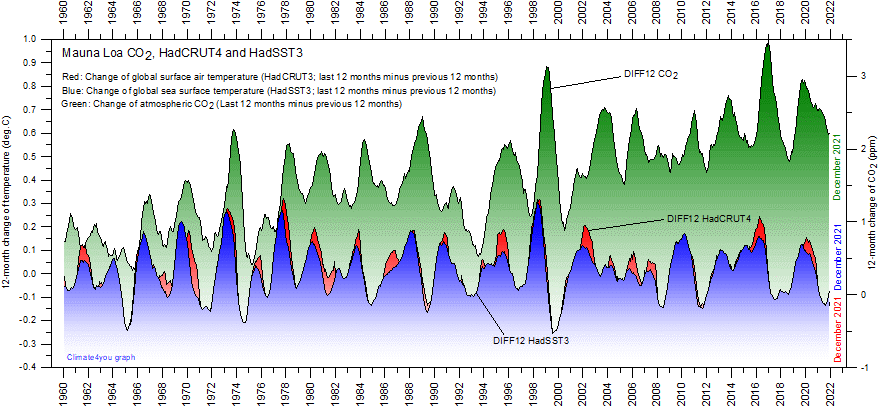
this chart updates the peer reviewed paper here.
12-month change of global atmospheric CO2 concentration (Mauna Loa; green), global sea surface temperature (HadSST3; blue) and global surface air temperature (HadCRUT4; red dotted). All graphs are showing monthly values of DIFF12, the difference between the average of the last 12 month and the average for the previous 12 months for each data series.Last month shown: October 2016. Last diagram update: 2 December 2016.
Real science shows that co2 levels trail change in ocean and sea temps.
Here we see one of the myraid ways we can see it.
For... brain blocked agw nutters... let me use colors to explain...
The blue area leads the green area. The red shows the diff... or the lead.
When you break down the data you see sea temp lead co2 by a year
Air temp lead by 9 months.
this chart updates the peer reviewed paper here.
12-month change of global atmospheric CO2 concentration (Mauna Loa; green), global sea surface temperature (HadSST3; blue) and global surface air temperature (HadCRUT4; red dotted). All graphs are showing monthly values of DIFF12, the difference between the average of the last 12 month and the average for the previous 12 months for each data series.Last month shown: October 2016. Last diagram update: 2 December 2016.
- Click here to read about data smoothing.
- Click here to read discussion on the fact that DIFF12 changes of atmospheric CO2 are tracking about 10-12 months aftercorresponding DIFF12 changes in air- and sea surface temperature.
- Click here to read the original paper (Humlum et al. 2012) on the phase relation between atmospheric CO2 and global temperature, describing in greater detail the interpretation of the diagram above.