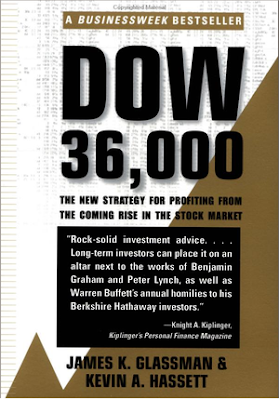
DO NOT STOP BUYING EQUITIES, I repeat do not stop buying, this rally is confirmed and more upside of 15%-20% or more is coming. KEEP BUYING.
This is the greatest bull market in the world.....

ââ¬ÅIt confirms the shift in market sentiment.ââ¬Â
Each cross foreshadowed returns of at least 16 percent during the following 18 months.
S&P 500 Moving Averages Show ââ¬ËFierceââ¬â¢ Rally: Technical Analysis
By Michael Patterson
Sept. 9 (Bloomberg) -- A rise in the Standard & Poorââ¬â¢s 500 Indexââ¬â¢s five-month moving average above its 15-month moving average for the first time since 2003 signals stocks are in the early stages of a bull market, said Alexander Associates LLP.
The S&P 500ââ¬â¢s five-month moving average climbed to 974.39 yesterday, higher than the 15-month moving average of 972.56, according to data compiled by Bloomberg.
The five-month moving average rose above the 15-month line three other times in the past two decades: March 1991, October 1994 and July 2003. Each cross foreshadowed returns of at least 16 percent during the following 18 months.
ââ¬ÅEvery time you see these two cross, it signifies a major event,ââ¬Â said Anthony Hughes, a London-based investment manager at Alexander Associates. ââ¬ÅIt confirms the shift in market sentiment.ââ¬Â
The S&P 500 has returned 53 percent since March 9, when it closed at a 12-year low, as second-quarter earnings topped analystsââ¬â¢ estimates and a rebound in manufacturing and home sales signaled the economy is recovering from its worst recession since the 1930s. The rally compares with a 121 percent return during the last major bull market, from Oct. 9, 2002, to Oct. 9, 2007.
The S&P 500ââ¬â¢s monthly moving average convergence/divergence line is another bullish sign for the market, according to Hughes. The so-called MACD rose above its signal line in July, indicating that the index is poised to climb, Hughes said. Technical analysts study chart patterns to predict prices.
ââ¬ÅIt starts to build a very strong case for a fierce bull rally,ââ¬Â Hughes said. Money managers ââ¬Åsee the stars aligning.ââ¬Â
This is the greatest bull market in the world.....
ââ¬ÅIt confirms the shift in market sentiment.ââ¬Â
Each cross foreshadowed returns of at least 16 percent during the following 18 months.
S&P 500 Moving Averages Show ââ¬ËFierceââ¬â¢ Rally: Technical Analysis
By Michael Patterson
Sept. 9 (Bloomberg) -- A rise in the Standard & Poorââ¬â¢s 500 Indexââ¬â¢s five-month moving average above its 15-month moving average for the first time since 2003 signals stocks are in the early stages of a bull market, said Alexander Associates LLP.
The S&P 500ââ¬â¢s five-month moving average climbed to 974.39 yesterday, higher than the 15-month moving average of 972.56, according to data compiled by Bloomberg.
The five-month moving average rose above the 15-month line three other times in the past two decades: March 1991, October 1994 and July 2003. Each cross foreshadowed returns of at least 16 percent during the following 18 months.
ââ¬ÅEvery time you see these two cross, it signifies a major event,ââ¬Â said Anthony Hughes, a London-based investment manager at Alexander Associates. ââ¬ÅIt confirms the shift in market sentiment.ââ¬Â
The S&P 500 has returned 53 percent since March 9, when it closed at a 12-year low, as second-quarter earnings topped analystsââ¬â¢ estimates and a rebound in manufacturing and home sales signaled the economy is recovering from its worst recession since the 1930s. The rally compares with a 121 percent return during the last major bull market, from Oct. 9, 2002, to Oct. 9, 2007.
The S&P 500ââ¬â¢s monthly moving average convergence/divergence line is another bullish sign for the market, according to Hughes. The so-called MACD rose above its signal line in July, indicating that the index is poised to climb, Hughes said. Technical analysts study chart patterns to predict prices.
ââ¬ÅIt starts to build a very strong case for a fierce bull rally,ââ¬Â Hughes said. Money managers ââ¬Åsee the stars aligning.ââ¬Â