Ewj: elliott wave

Silver'low at $13.9 is near 7-year Head and Shoulders' target around $13.7.
Multiple measured move target is $12.1.
Silver's Bear Market may come to an end soon.
View attachment 156634
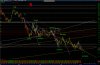
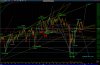
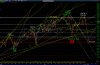
Silver Wave 4 invaded Wave 1 territory to end at $16.37.
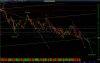
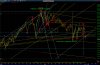
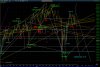
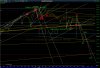
Wave 5.1 and 5.2 ended at $13.85 and $14.64.
Wave 5.3 current low at $13.75 may end near $12.5.
Wave IV)C5]5)5.5 may end near $12.1 or $11.5.
 

Attachments

  • 1212Silver5th_wave.jpg
    1212Silver5th_wave.jpg
    370.8 KB · Views: 26
  • 1212Silver_Wave5,5.jpg
    1212Silver_Wave5,5.jpg
    295.3 KB · Views: 26
USD/JPY went up to 125.85.
There may be another wave to 127.5 before some set back to 118.
USD/JPY tumbled to 116.128 without going up to 125.85. This may be Wave 3]4)
Wave 3]5)1,2,3,4 ended at 121.735, 118.065, 123.76, 120.582.
Wave 3]5)5 or alternate count Wave 3]5)1 may end near 126.36.
Alternate count Wave 3]5)5 may end near 157.
 

Attachments

  • 1212USDJPY126,5-157.jpg
    1212USDJPY126,5-157.jpg
    285.7 KB · Views: 24
  • 1212USDJPY_wave5or1.jpg
    1212USDJPY_wave5or1.jpg
    295.4 KB · Views: 23
Wave III3]3)5.5 is a wave 5 failure.
Wave III3]4) went UP to 1.145.
Wave III3]5) may go DOWN to 1.023.
EUR/USD Wave III3]4) ended at 1.17165.
Wave III3]5)1,2,3,4 ended at 1.10892, 1.14953, 1.05219, 1.10429.
Wave III3]5)5 may end near previous low at 1.04984 to form an A-B base,
or near 1.01 and 0.95.
 
Supercycle Wave III) 1974-2000
Supercycle Wave IV) 2000 - 2009 or 2016 target around 5,600.
Alternative count:
Cycle V)I 2009 - 2019 target around 27,000.
Primary V)I4] = Primary V)I2] at the moment.
Primary V)I3] = alternative Primary V)I1] which ended in 2010.
Note:
Cycle III)V = Cycle III)I-II-III.
View attachment 156321 View attachment 156322
INDU may give answer the long term question soon.
The 3-wave UP from 15,370 to 17,977 may be an a-b-c or 1-2-3.
The "Big M" pattern points to a fall to 16,933 where the question "a-b-c versus 1-2-3" will be answered.
 

Attachments

  • 1212INDU1)up_or_3)down.jpg
    1212INDU1)up_or_3)down.jpg
    394.7 KB · Views: 23
UTIL's Wave 1 ended at 565.35.
Irregular Wave 2 ended at 610.92.
Wave 3 fell to 539.96 below Wave 1 and may end at 525.
UTIL rebounded as Wave 3.2 then fall as Wave 3.3:1 as a 5-wave.
There may be a rebound as Wave 3.3:2 to 575 and
the a fall as Wave 3.3:3 to 520.
 

Attachments

  • 1212UTIL.jpg
    1212UTIL.jpg
    282.9 KB · Views: 22
Small "Big M"'s or Head and Shoulders pattern comfirmed.
Big "Big M" confirmation followed. Neck-lines turned into resistance levels.
The Waves to 1,867-1,993-1,903 may be Wave V)IV)E1]1)-2)-3) or Wave V)V)I4)-I5]1)-2).
SPX can go UP to 3,200 - 3400 or DOWN to 550.
Note: Decreasing Volume may indicate that these last waves are not part of Wave III).
View attachment 156430
SPX broke above neck-line then fell back as a confirmed "Big M" pattern.
SPX can go UP to 2,260 but this is less likely now.
SPX may fall to 1,850 soon.
 

Attachments

  • 1212SPX.jpg
    1212SPX.jpg
    338.2 KB · Views: 23
Last edited:
NASDAQ's rebound looks more like Wave 2)a-b-c than Wave 1)1-2-3-4-5 because wave 4 is overlapping wave 1. Wave 1)5 can be a wave-5-failure.
Wave 3) target is 4,080.
NASDAQ rose to test 2000 High for the fifth time and fell back below MA200 with a tentative "Big M" pattern.
If the "Big M" pattern is confirmed Wave IV]C1]3)1 target may be 4,250.
 

Attachments

  • 1212NASDAQ.jpg
    1212NASDAQ.jpg
    390.4 KB · Views: 21
INDU may give answer the long term question soon.
The 3-wave UP from 15,370 to 17,977 may be an a-b-c or 1-2-3.
The "Big M" pattern points to a fall to 16,933 where the question "a-b-c versus 1-2-3" will be answered.
And the answer is "a-b-c" of Wave V]IV)E1]2).
The last low at 15,450 may be Wave V]IV)E1]3)1 at the verge of another "Big M".
Wave V]IV)E1]3)2 rebounded to 16,136.
If the "Big M" are confirmed, Wave V]IV)E1]3)3 may go DOWN to 14,200.
For the long term.
Supercycle Wave III) 1974-2000
Supercycle Wave IV) 2000 - 2009 or 2016 target around 5,600.
 

Attachments

  • 0123INDU_answer.jpg
    0123INDU_answer.jpg
    346.6 KB · Views: 18
  • 0123INDU_Big_M.jpg
    0123INDU_Big_M.jpg
    212.5 KB · Views: 17
TRAN has multiple confirmed "Big M" patterns lately.
If the Big "Head and Shoulders" pattern is confirmed, TRAN may go DOWN to 6,700.
The Big "Head and Shoulders" was confirmed and TRAN went DOWN beyond 6,700 to 6,403 and rebounded to 6,879.
This may be Wave 3)1 and 3)2.
Wave 3)3 may go DOWN to 5,530 or 5,350.
 

Attachments

  • 0123TRAN_wave3)3.jpg
    0123TRAN_wave3)3.jpg
    284.9 KB · Views: 16
  • 0123TRAN_wave3)3.jpg
    0123TRAN_wave3)3.jpg
    284.9 KB · Views: 12
Back
Top