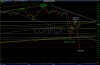
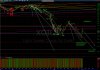
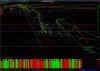
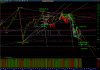
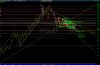
NASDAQ's rebound looks more like Wave 2)a-b-c than Wave 1)1-2-3-4-5 because wave 4 is overlapping wave 1. Wave 1)5 can be a wave-5-failure.NASDAQ fell to 4,292 then rebounded to 4,836 and fell again to 4,614.
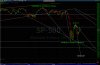
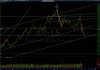
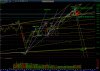
These may be Wave IV)C1]1)-2)-3) or Wave V)I4)-I5]1)-2).
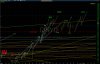
NASDAQ can go UP to 8,600-9,500 or fall DOWN to 1,150.
View attachment 156428
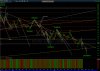
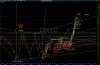
Wave 3) target is 4,080.