Ewj: elliott wave

$USD passed 99 target and moved on to 100.06.
This may be Wave 3]5)5.3.
After Wave .4 ends, Wave 3]5)5.5 may reached 61.8% Fibonacci Retracement target at 102.
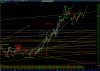
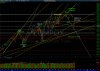
No move to 102. May be wrong count. Wave 3]5)5 ended at 100, a round number.
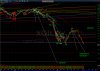
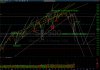
Wave 4] ended at 93.13.
Next may be Wave 5]1)3.1 to 100.66.
 

Attachments

  • 0819$USD_wrong_count.jpg
    0819$USD_wrong_count.jpg
    372.1 KB · Views: 34
Crude Oil didn't go up as expected but fell to $44.75 near previous low.
If this is a Flat Correction, Crude Oil may return to $54.24 as Wave 3)4.c .
Wave V]IV)C3]5) can go DOWN to $37 or $31.
Wave 4) was a Flat or Irregular Correction and went up to $62.58.
Wave V]IV)C3]5), $40.81 at the moment, may go DOWN to $35.5, $33.5 or $32.7.
 

Attachments

  • 0819Crude_Oil.jpg
    0819Crude_Oil.jpg
    315 KB · Views: 32
Gold rose to $1307.80 then fell.
This may be Wave IVc]5)3.4 or complex corrective wave IVc]4).
Wave IVc]5)3.5 can go DOWN to $1080.
Wave IVc]5) can go DOWN to $960.
Wave IVc]5)3.5:3iii went DOWN to $1,072.30 just below $1080 target then rebounded to $1,134.30 as wave iv.
Wave v can go DOWN to $1050, $1030 or $1013.
 

Attachments

  • 0819Gold.jpg
    0819Gold.jpg
    389.9 KB · Views: 33
INDU confirmed TRAN's Bearish signal.
INDU's Death Cross.
INDU's multiple "Big M" (moribund) patterns.
17037 = neckline.
"Big M" target = 15935 if confirmed.
Cannot upload Picture (Too large file error!)
INDU fell pass 17,037 neckline then tumbled beyond 15,935 to 15,370.
This may be Wave V]IV)E1]1) which has a lot more to go DOWN, or
Wave V]V)I4] which should stop at Wave V]V)I3]4) and then rebound to new high as Wave I5].
 
TRAN rebounded from 7,970 near Bigger "Big M" target @ 7,960 to 8530 near previous target @ 8,584.
Next target may be 7,700.
The uploaded file is too large for the server to process.
TRAN fell beyond 7,700 to 7,452 and rebounded to 7,936.
This may be Wave IV)C1]1) and 2) which should be followed by 3), or
Wave IV)E1]1) and 2) which should be followed by 3), or
Wave V)I4] and I5] which should go to new high.
 
Cannot upload Picture (Too large file error!)
INDU fell pass 17,037 neckline then tumbled beyond 15,935 to 15,370.
This may be Wave V]IV)E1]1) which has a lot more to go DOWN, or
Wave V]V)I4] which should stop at Wave V]V)I3]4) and then rebound to new high as Wave I5].
Supercycle Wave III) 1974-2000
Supercycle Wave IV) 2000 - 2009 or 2016 target around 5,600.
Alternative count:
Cycle V)I 2009 - 2019 target around 27,000.
Primary V)I4] = Primary V)I2] at the moment.
Primary V)I3] = alternative Primary V)I1] which ended in 2010.
Note:
Cycle III)V = Cycle III)I-II-III.
0829INDU.jpg
0828INDU.jpg
 
The uploaded file is too large for the server to process.
TRAN fell beyond 7,700 to 7,452 and rebounded to 7,936.
This may be Wave IV)C1]1) and 2) which should be followed by 3), or
Wave IV)E1]1) and 2) which should be followed by 3), or
Wave V)I4] and I5] which should go to new high.
TRAN:
Cycle IV)C versus Cycle V)I.
2,500 in 2016 versus 15,000 in 2019.
0829TRAN.jpg
 

Attachments

  • 0828TRAN.jpg
    0828TRAN.jpg
    296.7 KB · Views: 21
NASDAQ rebounded from 4,825 near BULL Trap support at 4,810 to 5,231 just above Year 2000's High then fell DOWN to 4,945.
There may be another new High.
NASDAQ fell to 4,292 then rebounded to 4,836 and fell again to 4,614.
These may be Wave IV)C1]1)-2)-3) or Wave V)I4)-I5]1)-2).
NASDAQ can go UP to 8,600-9,500 or fall DOWN to 1,150.
0901NASDAQ.jpg
 

Attachments

  • 0901NASDAQ_daily.jpg
    0901NASDAQ_daily.jpg
    361.4 KB · Views: 11
SPX's "Big M" failed. SPX is now in a trading range between 2,134 and 2,039 for more than half a year.
Small "Big M"'s or Head and Shoulders pattern comfirmed.
Big "Big M" confirmation followed. Neck-lines turned into resistance levels.
The Waves to 1,867-1,993-1,903 may be Wave V)IV)E1]1)-2)-3) or Wave V)V)I4)-I5]1)-2).
SPX can go UP to 3,200 - 3400 or DOWN to 550.
Note: Decreasing Volume may indicate that these last waves are not part of Wave III).
0901SPX.jpg
 

Attachments

  • 0901SPX_daily.jpg
    0901SPX_daily.jpg
    310.1 KB · Views: 10
Supercycle Wave III) 1974-2000
Supercycle Wave IV) 2000 - 2009 or 2016 target around 5,600.
Alternative count:
Cycle V)I 2009 - 2019 target around 27,000.
Primary V)I4] = Primary V)I2] at the moment.
Primary V)I3] = alternative Primary V)I1] which ended in 2010.
Note:
Cycle III)V = Cycle III)I-II-III.
View attachment 156321 View attachment 156322
INDU's rebound looks more like Wave 2)a-b-c than Wave 1)1-2-3-4-5 because wave 4 is overlapping wave 1. Wave 1)5 can be a wave-5-failure.
Wave 3) target is 14,600.
 

Attachments

  • 0903INDU_h.jpg
    0903INDU_h.jpg
    323.5 KB · Views: 12
Back
Top