AUD/USD 0.80660 target passed (low = 0.80352) .AUD/USD passed 0.82 target to as low as 0.81074.
Wave IIc]5)3.5 next target may be 0.80660.
Next may be a rebound to 0.860.
AUD/USD 0.80660 target passed (low = 0.80352) .AUD/USD passed 0.82 target to as low as 0.81074.
Wave IIc]5)3.5 next target may be 0.80660.
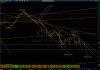
Gold fell as 5-wave to $1,170.70 then rebounded as 3-wave to $1,210.90.Gold rebounded to $1239.90 then fell.
Wave IVc]5)3.5 may go DOWN to $1,100 or $1,040.
Silver fell as 5-wave to $15.56, may be Wave :1,Silver rebounded to $17.35 then fell.
Next target may be $12.9 or $11.25.
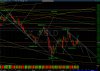
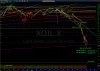
Crude Oil fell as expected to lower low at $52.03, may be wave i, ii and iii.Wave V]IV)C3]3)5 fell pass $75.3 to $73.25 then rebounded to $77.83.
Wave V]IV)C3]5) or 3]3)5.3 fell as parabolic to $53.60,
then rebounded to $57.15.
Wave V]IV)C3]5) may has one more sub-wave DOWN to $50.
Wave V]IV)C5] target may be $32.7.
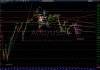
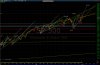
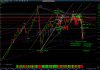
If SPX falls below the last trendline, it may confirm a "Big M" pattern and a b-wave.SPX rebound as expected passing 1900-1905 target to new high.
2079.46 may be Wave 5)1 top and 1972.56 Wave 5)2 bottom.
Wave 5)3 measured move target = 2255.
Beware Irregular b wave.
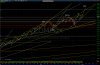
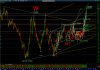
If NASDAQ falls below the last trendline, it may confirm a "Big M" pattern and a b-wave.There were a rebound from Oct 16, 2014 as expected.
4810.86 high may be Wave 5)3.
45747.31 low may be Wave 5)4.
Wave 5)5 may go UP to 5,270.
But beware an Irregular b wave.
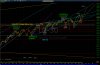
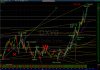
If INDU falls below the last trendline, it may confirm a "Big M" pattern and a b-wave.INDU didn't went down as expected, but shoot UP to all time high.
17991.19 may be Wave V]V)I3]5)1 top.
17067.59 may be Wave V]V)I3]5)2 bottom.
Next may be Wave V]V)I3]5)3 UP to 19,300.
Beware Irregular b wave.
There is Crude Oil wave v as expected.Crude Oil fell as expected to lower low at $52.03, may be wave i, ii and iii.
The rebound to $55.11 may be wave iv.
There may be wave v DOWN to $49.3, $48.5 or $45.9.
This may be Wave V]IV)C3]3)5 or V]IV)C3]5).
Wave V]IV)C5] target may be $32.7.
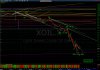
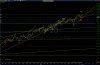
$USD 91.81 near 92.0 target and 2005 High at 92.63.$USD reached 91.2 target (high=91.15).
Now Wave 3] = Wave 1] and near 161.8%.
There may be some set back here or one more wave to 92.0.