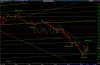
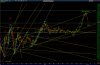
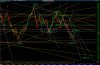
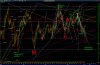
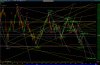
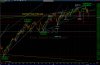
Gold (high = $1238) testing previous low@$1240.Gold (high = $1234) reached end of wave 4 of a lesser.
If Gold managed to pass previous low at $1240, Wave IVc]5)d's target may be $1313.
If Gold falls below previous low, Wave IVc]5)3.3 may be $1100.
If Gold managed to pass previous low at $1240, Wave IVc]5)d's target may be $1313.
If Gold falls below previous low, Wave IVc]5)3.3 may be $1100.
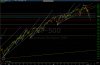
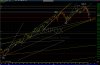
![1015$USD_wave3]2)or3]4).jpg](/et/data/attachments/127/127623-67fb006160746eecdadc87aedeb6c49d.jpg?hash=Z_sAYWB0bu)