You are using an out of date browser. It may not display this or other websites correctly.
You should upgrade or use an alternative browser.
You should upgrade or use an alternative browser.
Ewj: elliott wave
- Thread starter mu200411
- Start date
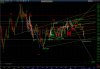
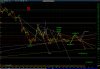
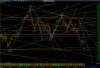
So far so good! 4610 is the top as expected.NASDAQ high 4610 may be the top of Wave V)I3]5)5 or V]I3]5)1 .
Next may be some set back to 4324.
"Big M" pattern confirmed. Target of Wave V]V)I3]5)2 may be 4324.
Wave V]V)I4] target may be 3946.
Attachments

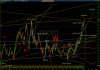
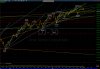
SPX's "Big M" pattern confirmed. Wave 3)5.5 or Wave 3)5.1 might have ended."Big M" pattern.
This may be the end of Wave 5.5 or 5.5:1?
Rebound from here means 5.5:1.
A fall to 1905 means Wave 5.5 has ended.
Wave 3)5.2 target is at Wave :4 (labeled .4) = 1904.
Wave 4) target = 1740 .
Attachments
Last edited:
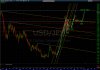
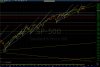
INDU's Ending Diagonal target for Wave V]V)I4) = 14,720 if Wave V]V)I3)5 has just ended.A strong rebound, so INDU should be in Wave 5)5.
If the ending wave is V]V)I3]5)1, target may be 16,334.
Attachments
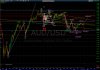
Crude Oil measured move targets = $87 or $87.5 .Crude Oil $91.80 is at pivotal point.
Last chance to rebound as Wave 3).
If drops below Wave 1) low at $91.24 then it is not Wave 2),
and a fall to $87 is more likely.
Attachments
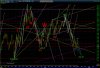
Gold fell below $1240 then approached $1200 as expected.Gold has finished 5-3-5 waves.
If Gold rises above the green horizontal line at $1281, it will confirm Wave 3)3.
And Gold can go UP to $1365.
If Gold falls below the blue horizontal line at $1240, it means Wave 2) is still in force.
And Gold can go DOWN to $1200.
Recent low = $1204.30.
Measured move targets = $1200 or $1180.
Attachments
Silver's Wave V]V)IVc]5) is not a failure, last low = $16.85 .Silver didn't go DOWN as low as expected.
Wave V]V)IVc]5) might have been a wave five failure.
Next may be Wave V]V)V1]1)3 UP to $22.85 .
If not Wave V]V)IVc]5) may continue DOWN to $16 or $14.65 .
There may be some rebound as wave :4 before going DOWN to $16 as Wave 5)5.3:5.
Wave V]V)IVc]5)5.5 may end near $14.0