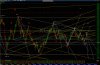
After $USD reaches 85 if QE4 $USD will go DOWN 41.33% to 35.1 in 6 years or more.It didn't in the past. It doesn't now. It'll not in the future.
If no $USD will go UP to 120.51 in 3 years or more.
After $USD reaches 85 if QE4 $USD will go DOWN 41.33% to 35.1 in 6 years or more.It didn't in the past. It doesn't now. It'll not in the future.
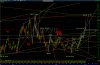
If Gold cannot pass $1324 soon,Gold may go UP as Wave 3)3 to $1390 soon.
Gold has finished 5-3-5 waves.If Gold cannot pass $1324 soon,
it may go DOWN to $1050, $960 or $860.
It looked as if Wave :4 or .4 (we may have to up the count one degree) was a Running Correction.After $USD reaches 85 if QE4 $USD will go DOWN 41.33% to 35.1 in 6 years or more.
If no $USD will go UP to 120.51 in 3 years or more.
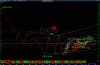
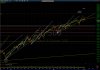
$USD@84.5 reaches "W" pattern target and is approaching other targets.It looked as if Wave :4 or .4 (we may have to up the count one degree) was a Running Correction.
Measured move target is still 85.
"W" pattern target is 84.5 .
Previous tops target are 84.97 and 84.6 .
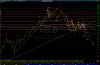
Gold at support. $USD at resistances.Gold has finished 5-3-5 waves.
If Gold rises above the green horizontal line at $1281, it will confirm Wave 3)3.
And Gold can go UP to $1365.
If Gold falls below the blue horizontal line at $1240, it means Wave 2) is still in force.
And Gold can go DOWN to $1200.
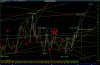
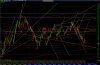
Crude Oil $91.80 is at pivotal point.Crude Oil did not rebounded as expected because Wave 2)c extended into .1 .2 .3 .4 and .5 which seems to form a descending wedge.
Next should be a rebound as Wave 3) to $109 .
But a DOWN move to $87 is also possible.
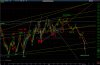
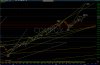
NASDAQ high 4610 may be the top of Wave V)I3]5)5 or V]I3]5)1 .NASDAQ may go UP to 4620 or
DOWN to 4300.