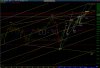
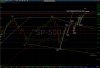
SPX fell as low as 1770.45 then rebounded.
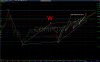
May be forming Right Shoulder to as high as 1813 then fall again.
May be forming Right Shoulder to as high as 1813 then fall again.
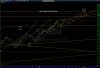
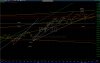
SPX fell from the last measured move resistance.
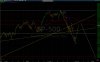
Note "Big M" pattern target = 1769.99.
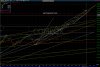
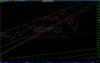
Is this the beginning of a larger correction?
http://www.elitetrader.com/vb/attachment.php?attachmentid=142508&d=1390739300