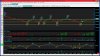
Chart 1 is a Renko 6-tick chart. At the yellow bar at 1 an alert is triggered of a lower-low on higher wave volume (vs. the previous reaction at 2) with Delta Momentum making a higher-low at 4 (and looking extreme). (The alerts come 2-3 bars after the actual occurrence due to the nature of the Zig-Zag indicator.)
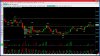
Once the alert has triggered on the Renko I go to the 5-min chart, Chart 2, where the alert from the Renko chart would come at A. At this point price has been in a very nice range following a sharp short-term down wave. A is a very shallow spring of B, which was a climax low and where the consolidation starts. Though the volume at wave A is not particularly impressive as far as effort vs. reward, the total wave volume for the two waves of this reaction off the previous high/upthrust can be considered significant in this range, with little follow-thru for that effort.
The blue rectangle encompasses the volume profile to that point at A. I'm still relatively new to Market & Volume Profile, but one of the criticisms is that in many cases, such as a trend day (where rejection areas are more significant) the value area is relatively meaningless. However, in a consolidiation, I think the value area can provide information. For instance, at A, the volume histogram has formed a very nice bell curve and the point of control on the histogram (POC, the highest volume at price, orange line) is quite extended. The POC can go on extending for quite some of time, natch (as this POC indeed does eventually) but one can also consider that value, in a relatively well-established short-term consolidation, is valid and therefore perhaps it's time for price to move on for a bit. The gray dashed lines represent the volume value area within the profile. Once a value area has been established in a profile (consolidation) it, along with the POC, can act as a price magnet, drawing price back to it. Therefore, in a range, once price has violated the value area, one might reasonably expect, always considering the nature of the price action, that price will return to the value area.
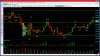
Chart 3. I've extended the VP. Following the shallow spring, price rallies back into the value area to the previous POC. At X there is a wide spread closing near the low, that one bar pivoting around that POC from the first VP, followed by the widest spread up closing on the high in 15 bars, since the previous high/upthrust at Y.
Beginning at Z consider the nature of the previous rally & current reaction: The rally is relatively strong on good wave volume, recovering much of the loss of the previous two reactions and doing so much quicker than the previous down wave. Except for a brief pause, it shoots thru that previous POC and closes near the top of the value area. The reaction is shallow, nowhere near 50% and the opens and closes cluster, often a sign of price failure to make progress in the current reaction/rally. At Z price has again breached the value area, yet unlike the previous instance it does not almost immediately migrate toward the previous POC, rather it hangs above it. Note how near the end of the consolidation the POC (brown dashed line again) in this extended volume profile has migrated considerably higher, to the top of the value area and nearer the top of the range. So value is higher, there is a consolidation near the top of the range, mostly above value and the rising POC, then at 1 a shallow test of the previous low on low wave vol, still hanging near the top of the VA and at the POC, followed by the widest spread up bar closing on the high since the Y high.
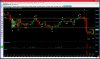
Chart 4. There is rally to 2, above the range. Always considering an upthrust, this is followed by two weak upthrusting down bars. At 3 a massive wide spread outside bar closing at the low encompassing this current brief range at previous significant resistance. Ugly.
Once the alert has triggered on the Renko I go to the 5-min chart, Chart 2, where the alert from the Renko chart would come at A. At this point price has been in a very nice range following a sharp short-term down wave. A is a very shallow spring of B, which was a climax low and where the consolidation starts. Though the volume at wave A is not particularly impressive as far as effort vs. reward, the total wave volume for the two waves of this reaction off the previous high/upthrust can be considered significant in this range, with little follow-thru for that effort.
The blue rectangle encompasses the volume profile to that point at A. I'm still relatively new to Market & Volume Profile, but one of the criticisms is that in many cases, such as a trend day (where rejection areas are more significant) the value area is relatively meaningless. However, in a consolidiation, I think the value area can provide information. For instance, at A, the volume histogram has formed a very nice bell curve and the point of control on the histogram (POC, the highest volume at price, orange line) is quite extended. The POC can go on extending for quite some of time, natch (as this POC indeed does eventually) but one can also consider that value, in a relatively well-established short-term consolidation, is valid and therefore perhaps it's time for price to move on for a bit. The gray dashed lines represent the volume value area within the profile. Once a value area has been established in a profile (consolidation) it, along with the POC, can act as a price magnet, drawing price back to it. Therefore, in a range, once price has violated the value area, one might reasonably expect, always considering the nature of the price action, that price will return to the value area.
Chart 3. I've extended the VP. Following the shallow spring, price rallies back into the value area to the previous POC. At X there is a wide spread closing near the low, that one bar pivoting around that POC from the first VP, followed by the widest spread up closing on the high in 15 bars, since the previous high/upthrust at Y.
Beginning at Z consider the nature of the previous rally & current reaction: The rally is relatively strong on good wave volume, recovering much of the loss of the previous two reactions and doing so much quicker than the previous down wave. Except for a brief pause, it shoots thru that previous POC and closes near the top of the value area. The reaction is shallow, nowhere near 50% and the opens and closes cluster, often a sign of price failure to make progress in the current reaction/rally. At Z price has again breached the value area, yet unlike the previous instance it does not almost immediately migrate toward the previous POC, rather it hangs above it. Note how near the end of the consolidation the POC (brown dashed line again) in this extended volume profile has migrated considerably higher, to the top of the value area and nearer the top of the range. So value is higher, there is a consolidation near the top of the range, mostly above value and the rising POC, then at 1 a shallow test of the previous low on low wave vol, still hanging near the top of the VA and at the POC, followed by the widest spread up bar closing on the high since the Y high.
Chart 4. There is rally to 2, above the range. Always considering an upthrust, this is followed by two weak upthrusting down bars. At 3 a massive wide spread outside bar closing at the low encompassing this current brief range at previous significant resistance. Ugly.