You are using an out of date browser. It may not display this or other websites correctly.
You should upgrade or use an alternative browser.
You should upgrade or use an alternative browser.
ES vs NQ
- Thread starter traderwald
- Start date
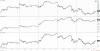
The three indices on a selected day a few weeks back. I don't see any significant differences.
I won't argue anyone else's choice of instrument, but I've seen comments (in other threads) about how superior NQ/YM is to ES and it seems to me to be a bit exaggerated.
I won't argue anyone else's choice of instrument, but I've seen comments (in other threads) about how superior NQ/YM is to ES and it seems to me to be a bit exaggerated.
Attachments
The three indices on a selected day a few weeks back. I don't see any significant differences.
I won't argue anyone else's choice of instrument, but I've seen comments (in other threads) about how superior NQ/YM is to ES and it seems to me to be a bit exaggerated.
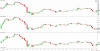
You are doing a visual compare. That shows you correlation, but not the money potential.
In the case of futures, that requires the specifications such as tic increment and tic value.
Using your charts, and 2 eyeballs to *approximate* the high and low price on each chart, I come up with this...
YM 25755-25610, 145 tics/145pts, $5/tic = $725
NQ 7471-7419, 208 tics/52pts, $5/tic = $1040
ES 2869-2857, 48 tics/12pts, $12.5/tic = $600
IMO, NQ handily "wins" using your example, when looking at money potential trading opportunity. I happen to think it is "easier" to pick off say $100 bucks from a range worth say $1000, than it is to pick off the same $100 bucks from a range worth say $500. jmo.
ES vs NQ really depends on the type of trading and the size.
Thanks, Xela. I appreciate it! I am going to ruminate on this for a week or two.
You are doing a visual compare. That shows you correlation, but not the money potential.
In the case of futures, that requires the specifications such as tic increment and tic value.
Using your charts, and 2 eyeballs to *approximate* the high and low price on each chart, I come up with this...
YM 25755-25610, 145 tics/145pts, $5/tic = $725
NQ 7471-7419, 208 tics/52pts, $5/tic = $1040
ES 2869-2857, 48 tics/12pts, $12.5/tic = $600
IMO, NQ handily "wins" using your example, when looking at money potential trading opportunity. I happen to think it is "easier" to pick off say $100 bucks from a range worth say $1000, than it is to pick off the same $100 bucks from a range worth say $500. jmo.
For the record, I like this post 1+∞
You are doing a visual compare. That shows you correlation, but not the money potential.
In the case of futures, that requires the specifications such as tic increment and tic value.
Using your charts, and 2 eyeballs to *approximate* the high and low price on each chart, I come up with this...
YM 25755-25610, 145 tics/145pts, $5/tic = $725
NQ 7471-7419, 208 tics/52pts, $5/tic = $1040
ES 2869-2857, 48 tics/12pts, $12.5/tic = $600
IMO, NQ handily "wins" using your example, when looking at money potential trading opportunity. I happen to think it is "easier" to pick off say $100 bucks from a range worth say $1000, than it is to pick off the same $100 bucks from a range worth say $500. jmo.
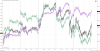
Sure, it's a visual comparison, but still illustrative since the price action (swings and turning points) is similar.
More precise numbers on that specific day:
YM = 161 points = 805 $
NQ = 63 points = 1260 $
ES = 15,25 points = 762,5 $
I have never argued that NQ isn't less volatile, but in terms of trading instruments, it seems like an exaggeration when people are bashing the ES in comparsion seeing how they move similarly a lot of the time.