I'm coding some custom order management / handling for unattended automated ES trading during Globex hours (by which I mean between specifically 16h30 -> 09h30 EST... so it's "unattended" because I hope to be asleep for much of that time!).
My biggest concern is an unwanted fill during an exceptionally large and sudden move arising from a market shock during these hours (i.e. ES is much less liquid than during regular trading hours, so sudden moves can be bigger and faster).
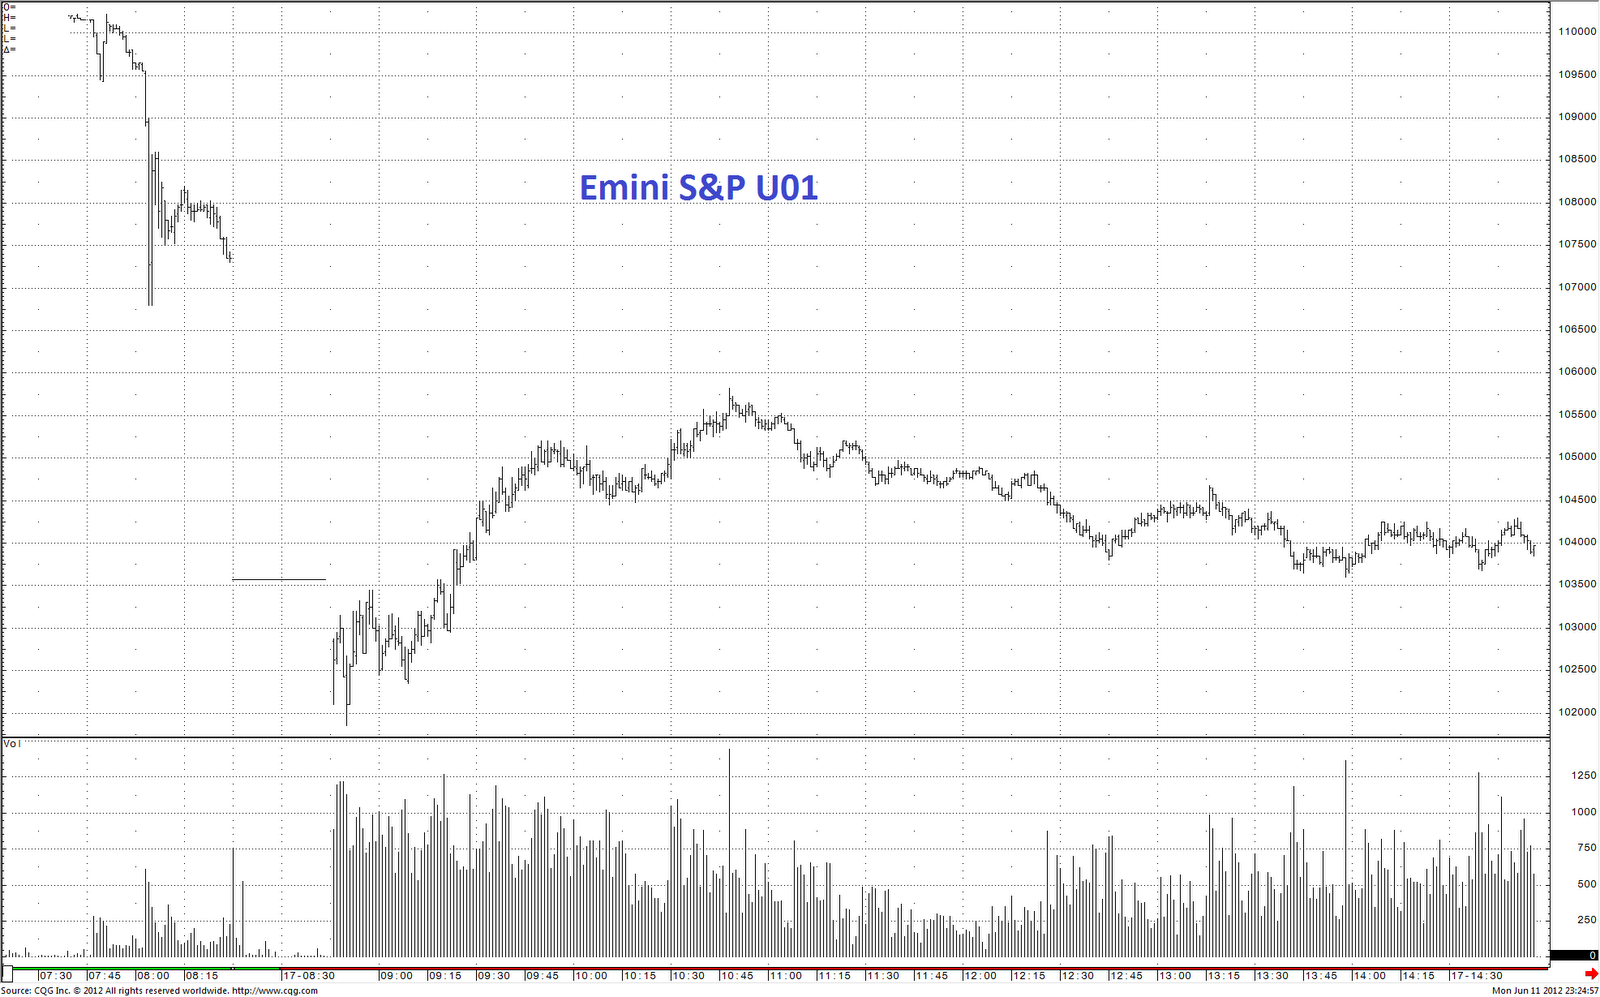
I'd be very interested to review a tick data chart for the ES Sep 2001 contract for the hour from 08h30 - 09h30 EST on Sep 11, 2001. I am told this period represents an empirical example of an "as-bad-as-it-can-get" situation in the ES, in terms of sudden, large moves. But I wasn't trading at the time, and don't have this data.
Is there anyone who can post a chart?
Or even post the tick data for this time period?
Thanks.
My biggest concern is an unwanted fill during an exceptionally large and sudden move arising from a market shock during these hours (i.e. ES is much less liquid than during regular trading hours, so sudden moves can be bigger and faster).
I'd be very interested to review a tick data chart for the ES Sep 2001 contract for the hour from 08h30 - 09h30 EST on Sep 11, 2001. I am told this period represents an empirical example of an "as-bad-as-it-can-get" situation in the ES, in terms of sudden, large moves. But I wasn't trading at the time, and don't have this data.
Is there anyone who can post a chart?
Or even post the tick data for this time period?
Thanks.