You are using an out of date browser. It may not display this or other websites correctly.
You should upgrade or use an alternative browser.
You should upgrade or use an alternative browser.
ES Journal | Divergence918
- Thread starter Iwilldoit
- Start date
My way of trading is high frequent scalping, unlike yours, I just don't have the patience any more, maybe age or more likely stats, but I try to get 12-15 trades in a hour, I will post some of my charts if ok with you, I don't mark exact entries too often as it allows readers to do their own back testing and colored arrows show type of trade. But within chart itself are often patterns that can help you identify times I expect reversals like Triple tops/bottoms near or at "Swing ave" which is usually between 7-8 points. Head and Shoulders shows high percentage trades. Volume divergence are best at extremes, Volume should be reducing as price makes higher closes at highs of a wave (waves make up a Swing) and lower closes of a wave. Waves normally are 3-5 points and "dips" or counter waves as in 2 and 4 of Elliott wave(Elliott said to have 5 waves in completed trend, 3 trend waves and 2 counter-trend), so the counter trend waves 2 & 4 are normally what traders look for in taking a trend trade, usually the coming out of wave 4 is shortest of all waves. BUT when dealing with short time frames, number of waves are seldom 5 waves, but knowing about the size of the waves you can keep track of where reversals most like might come in.
There is also pattern show when not to take trades even when you have a signal, Triple highs/lows, you might not take counter trend trades which is fine, but you better know where they coming in cause it you have a trend trade coming in where many that do counter trend, you can expect to be paying worst price when you could have waited for more retrace and get in better or passed on trade altogether. Today's trading saw a Megaphone, usually at conclusion of 4th pivot you can readily see it forming and I stop taking trend breakout trades cause it usually loss for me, is an average wave in 4.5 points and from lows to breakout is 3.00 points you have a possible 1.50 points left but unless market really takes off and you trying to get more, that trend might be ending and become a lower high, Megaphones don't last forever but you can expect them almost each week. It is good to know where other traders are getting in even if you not getting here in those signals, I developed an automated system where it trades failure signals, it searches for approx. 50 different types of signals and time ending for those signals will take opposite trades.
The importance of breakeven plus one tick, I had 22 trades today in 70 minutes and 11 were of Breakeven plus one tick, seven of them if I waited would have become losers and other 4 would not have covered losses. So I rather get out with a tick and look for a trade that will make more profits. But even if I had done 22 trades of one tick and if I was paying retail I would have net $187 per lot, so when you suffering losing days, start thinking about plus one tick.
@Handle123 Thank You this is a great post!
I will post some of my charts if ok with you, I don't mark exact entries too often as it allows readers to do their own back testing and colored arrows show type of trade. But within chart itself are often patterns that can help you identify times I expect reversals like Triple tops/bottoms near or at "Swing ave" which is usually between 7-8 points.
Yes please flood my thread with charts, I really would appreciate it.
I read your post a few times, still trying to make sense out of the chart you posted.
@Handle123
TRADE ONE: LONG/ PROFIT/ BLD/60/15H30

So on the 60 I see the stochs crossover to signal Bull Divergence.
15h31 I set my limit order to 22.75, TARGET= 24.75, INITIAL STOP = 21
EXECUTION
As soon as I was filled at 22.75, price surged and I quickly moved my target order on the DOM to 24.25 (didnt have enough time to calculate my target) . (My OCO configuration on the DOM is preset to Target = 1 point above entry and Initial Stop= 2 points below (Long), I do of course move them after calculations. )
IN TRADE PERFORMANCE
Well I was filled at 24.25 on the next candle, but as I already mentioned in a previous post, I do not recognize a fill until price travels through it. Therefore I "held" my trade to anticipate the 24.75 target.
I then calculated the my target at 24.75 (Yes I know most would think this is a foolish target)
After I saw the green candle at 15h33, I moved up my initial stop from 21 → 21.75 (Using the DOM).
EXIT
Despite the fact price dropping to 22.5 at 15h51→ I considered closing my position and expecting to get stopped out→ BUT THAT IS AGAINST MY RULES , MY RULES STATE TO WAIT UNTIL YOU EITHER GET STOPPED OUT OR HIT THE TARGET!
So I proceeded to wait until either one of these outcomes occurs→ Price eventually broke the 24.75 level at 15h57 (entries and exits marked with a pink ellipse) .
Nice to end the week on a profitable trade. I will post up my weekly metrics later.
WHAT I LEARNT
I wonder how this would of played out in a real live "money" trade?
@Handle123 @Redneck
@NoDoji @Buy1Sell2 @aquarian1
@Gueco @pak @slugar @zbestoch
So on the 60 I see the stochs crossover to signal Bull Divergence.
15h31 I set my limit order to 22.75, TARGET= 24.75, INITIAL STOP = 21
EXECUTION
As soon as I was filled at 22.75, price surged and I quickly moved my target order on the DOM to 24.25 (didnt have enough time to calculate my target) . (My OCO configuration on the DOM is preset to Target = 1 point above entry and Initial Stop= 2 points below (Long), I do of course move them after calculations. )
IN TRADE PERFORMANCE
Well I was filled at 24.25 on the next candle, but as I already mentioned in a previous post, I do not recognize a fill until price travels through it. Therefore I "held" my trade to anticipate the 24.75 target.
I then calculated the my target at 24.75 (Yes I know most would think this is a foolish target)
After I saw the green candle at 15h33, I moved up my initial stop from 21 → 21.75 (Using the DOM).
EXIT
Despite the fact price dropping to 22.5 at 15h51→ I considered closing my position and expecting to get stopped out→ BUT THAT IS AGAINST MY RULES , MY RULES STATE TO WAIT UNTIL YOU EITHER GET STOPPED OUT OR HIT THE TARGET!
So I proceeded to wait until either one of these outcomes occurs→ Price eventually broke the 24.75 level at 15h57 (entries and exits marked with a pink ellipse) .
Nice to end the week on a profitable trade. I will post up my weekly metrics later.
WHAT I LEARNT
- Follow the rules of the model no matter what > Dont be afraid to be stopped out!
- Expect price to move rapidly as soon as you are filled, so be prepared to move Target/Stop orders
I wonder how this would of played out in a real live "money" trade?
@Handle123 @Redneck
@NoDoji @Buy1Sell2 @aquarian1
@Gueco @pak @slugar @zbestoch
Last edited:
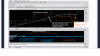
I see sometimes being rigid at far as targets you can lose it all trying to get one tick when chart showing huge resistance and head & shoulders, you don't want to get into "hope" mode.
Ideas are on enclosed chart.
Congrats on your first week, stay the course and keep emotions in check.
Ideas are on enclosed chart.
Congrats on your first week, stay the course and keep emotions in check.
Attachments
My way of trading is high frequent scalping, unlike yours, I just don't have the patience any more, maybe age or more likely stats, but I try to get 12-15 trades in a hour,.
Hi @Handle123 , I'm not sure how much you are paying for commissions, but futures commissions are nearly half as much as stocks commissions for me, that is one of the reasons I trade futures as opposed to stocks (as mentioned before).
If I could get cheap commissions for futures then yes I would be adopting a scalping strategy, another reason why I am a bit "longer" term than scalping.
I see sometimes being rigid at far as targets you can lose it all trying to get one tick when chart showing huge resistance and head & shoulders, you don't want to get into "hope" mode.
Ideas are on enclosed chart.
Congrats on your first week, stay the course and keep emotions in check.
@Handle123
On the 1 minute charts you marked up, I noticed you were analyzing the stochastic divergence.
Do you respect stochastic divergence signals on the 1 minute timeframe?
I am of the opinion, that they tend to only be more reliable in the larger timeframes, therefore my model only recognizes divergences on 30 & 60min.
Just curious,
IWDI.
Hi @Handle123 , I'm not sure how much you are paying for commissions, but futures commissions are nearly half as much as stocks commissions for me, that is one of the reasons I trade futures as opposed to stocks (as mentioned before).
If I could get cheap commissions for futures then yes I would be adopting a scalping strategy, another reason why I am a bit "longer" term than scalping.
I lease seats, so I am not paying retail. I also have employees that trade my funds, so I can do well making one tick, but you should be able to do well getting one tick too. I was trading over 100 lots before I went into leasing a seat. More you average a month, deeper the comm go.