I’m starting to wonder if that could have been it on the downside for September.
Just putting it out there…
Considering the Globex long tonight.
I don't think this move lower is over, personally.
I’m starting to wonder if that could have been it on the downside for September.
Just putting it out there…
Considering the Globex long tonight.
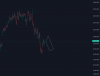
We should get 1 more follow-through tomorrow (or maybe 2 days with smaller bars) with the target of 5550-ish. But I don't think we're done with selling just yet.I’m starting to wonder if that could have been it on the downside for September.
Just putting it out there…
Considering the Globex long tonight.
LOL you old fogey.I thought the same around April of 2000 and March 07")

We should get 1 more follow-through tomorrow (or maybe 2 days with smaller bars) with the target of 5550-ish. But I don't think we're done with selling just yet.
I don't think this move lower is over, personally.
LOL you old fogey.
Anyway it sure feels like '07 all over again, doesn't it? We'll be retesting the April low once we're done with this pullback here.
Very possible. I don’t have a strong opinion at this point.
Have it felt like 07 other times since 07 or is this the first time?
I just know how fast this market have recovered in the past catching people off guard. The plunge prior to this one for example.
It is funny, I copied/plotted your scenario in here, and while it feels like a big bear, she becomes just cute when you look at the monthly chart for perspective:LOL you old fogey.
Anyway it sure feels like '07 all over again, doesn't it? We'll be retesting the April low once we're done with this pullback here.
Excuse this pussy for not recognizing the real lion.It is funny, I copied/plotted your scenario in here, and while it feels like a big bear, she becomes just cute when you look at the monthly chart for perspective:
View attachment 348693
It is log, just look at the axis. Look for fun at the MSFT monthly chart (log), 2013-2022 is just 1 straight line.Excuse this pussy for not recognizing the real lion.
In any case, you should use a log chart, which is more representational when it comes to these super long term charts. And keep that trendline in mind, might I add. If we ever break below that trendline, all hell will break loose.
View attachment 348696
")