You are using an out of date browser. It may not display this or other websites correctly.
You should upgrade or use an alternative browser.
You should upgrade or use an alternative browser.
ES Journal - 2021/2022
- Thread starter Buy1Sell2
- Start date
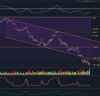
Mixed clues on the hourly chart (SPY).
Starting to see capitulation volume and the golden ratio extension target, but no momo divergences yet. Although, it sure "feels" ripe for a violent bounce......
I don't like it. The pundits are starting to talk about capitulation, but the VIX is only at 30-31. I think they are also behind the curve, like Powell.
So you're basing your decision (and money) on some past event that might or might not happen? Unfortunately, you need to wait a while. According to this chart, the reversal didn't happen until December 26. We're still in September.History. I am thinking of Q4 2018.
My sources are telling me the bears will get their ass raped tomorrow. There are too many scared money among the bears. We need to shake them off before going down in earnest.Starting to see capitulation volume and the golden ratio extension target, but no momo divergences yet. Although, it sure "feels" ripe for a violent bounce......
So we definitely have a lot of indicators that are consistent with a major low -- and admittedly, I have a little FOMO on the potential 4th quarter rally. However, the trend and momentum are still down and I don't have "harmony" across my time frames -- meaning my longer term charts still aren't signalling a potential reversal.
My sources are telling me the bears will get their ass raped tomorrow. There are too many scared money among the bears. We need to shake them off before going down in earnest.
So we definitely have a lot of indicators that are consistent with a major low -- and admittedly, I have a little FOMO on the potential 4th quarter rally. However, the trend and momentum are still down and I don't have "harmony" across my time frames -- meaning my longer term charts still aren't signalling a potential reversal.
Its going to be the typical bear graveyard when this thing bottoms.
Soon.
In the meantime the bull graveyard is almost at full capacity - and likely any bounce is short term.Its going to be the typical bear graveyard when this thing bottoms.
Soon.
Its going to be the typical bear graveyard when this thing bottoms.
Soon.
As in the bottom or a short term bottom?
I'd love to hear why you think we'll have a long term bottom soon considering that the FED stopped juicing the markets.
Why oh why do people continue to look to go .... higher?
Other than schizo who flips more times than a 14 year old Olympic Gymnast.
Probably because we just completed the longest and largest bull market in history. People are conditioned to BTFD. Even the bears...
")
Now that I got with the program and see what you all were referring to but TradeStation shows 19 (including today) instances going back to 2008.
To be clear, the condition I checked for:
6 in a row where both:
a) Net change was negative
b) Close below Open (which gives the red candle) was negative
Also, I use the RTH session template for this as what I'm really looking at for daily charts is the SPX.
If you get 19 instances, I have an error in my dataset, but I suspect not. Would be nice to clarify.