You are using an out of date browser. It may not display this or other websites correctly.
You should upgrade or use an alternative browser.
You should upgrade or use an alternative browser.
ES Journal - 2019/2020
- Thread starter Buy1Sell2
- Start date
- Status
- Not open for further replies.
Know the difference between buying the dip and boxing a kangaroo there Dundee?.....
There is none.
Gtfo while you still can.

I'm bailing out pronto.Know the difference between buying the dip and boxing a kangaroo there Dundee?.....
There is none.
Gtfo while you still can.
Loading up BBOZ.AX & BBUS.AX (shorts ETF)
Since Vanz has made it abundantly clear that I am not allowed to post a response to his post, then I will ask the rest of the audience, who wishes to have a discussion about it...
Why is the DOW the biggest "scam" on earth? It's just an index, like every other index. What is the big scam with the DJIA 30, and the Global Dow 150? They are weighted differently, yes...How is an index a "scam"?
Why is the DOW the biggest "scam" on earth? It's just an index, like every other index. What is the big scam with the DJIA 30, and the Global Dow 150? They are weighted differently, yes...How is an index a "scam"?
Why is the DOW the biggest "scam" on earth? It's just an index, like every other index. What is the big scam with the DJIA 30, and the Global Dow 150? They are weighted differently, yes...How is an index a "scam"?
The Dow Jones Industrial Average is price-weighted, so stocks in the index with higher prices have more influence than stocks with lower prices (because of greater absolute price moves).
https://www.nakedcapitalism.com/2014/05/the-dow-jones-industrial-average-is-a-hoax.html
The Dow Jones Industrial Average is a Hoax
Posted on May 10, 2014 by Yves Smith
Yves here. On the occasion of an all-time high, a hard look at how the Dow Jones Industrial Average is constituted is in order.
By Wim Grommen, a teacher in mathematics and physics and later a trainer of programmers in Oracle software. He has also studied and written about transitions, social transformation processes, the S-curve and transitions in relation to market indices. His paper “The present crisis, a pattern: current problems associated with the end of the third industrial revolution” was accepted for an International Symposium in Valencia: “The Economic Crisis: Time for a paradigm shift, Towards a systems approach”
The Dow Jones Industrial Average (DJIA) Index is the only stock market index that covers both the second and the third industrial revolution. Calculating share indexes such as the Dow Jones Industrial Average and showing this index in a historical graph should therefore be a useful way to show which phase the industrial revolution is in. Changes in the DJIA shares basket, changes in the formula and stock splits during the take-off phase and acceleration phase of industrial revolutions are perfect transition-indicators. The similarities of these indicators during the last two revolutions are fascinating, but also a reason for concern. In fact the graph of the DJIA is a classic example of fictional truth, a hoax.
Transitions
Every production phase, civilization or other human invention goes through a so called transformation process. Transitions are social transformation processes that cover at least one generation. In this article I will use one such transition to demonstrate the position of our present civilization and its possible effect on stock exchange rates.
A transition has the following characteristics:
– It involves a structural change of civilization or a complex subsystem of our civilization
– It shows technological, economical, ecological, socio cultural and institutional changes at different levels that influence and enhance each other
– It is the result of slow changes (changes in supplies) and fast dynamics (flows)
A transition process is not fixed from the start because during the transition processes will adapt to the new situation. A transition is not dogmatic.
Four Transition Phases
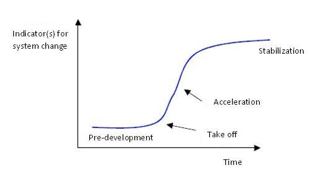
In general transitions can be seen to go through the S curve and we can distinguish four phases.
Figure 1: The four phases in a transition best visualized by means of an S curve: Pre-development, Take-off, Acceleration, Stabilization.
1. A pre development phase of a dynamic balance in which the present status does not visibly change
2. A take off phase in which the process of change starts because of changes in the system
3. An acceleration phase in which visible structural changes take place through an accumulation of socio cultural, economical, ecological and institutional changes influencing each other; in this phase we see collective learning processes, diffusion and processes of embedding
4. A stabilization phase in which the speed of sociological change slows down and a new dynamic balance is achieved through learning
A product life cycle also goes through an S curve. In that case there is a fifth phase:
5. The degeneration phase in which cost rises because of over capacity and the producer will finally withdraw from the market
When we look back into the past we see three transitions, also called industrial revolutions, taking place with far-reaching effect :
1. The first industrial revolution (1780 until circa 1850); the steam engine
2. The second industrial revolution (1870 until circa 1930); electricity, oil and the car
3. The third industrial revolution (1950 until ….); computer and microprocessor
Dow Jones Industrial Average (DJIA)
The Dow Index was first published in 1896 when it consisted of just 12 constituents and was a simple price average index in which the sum total value of the shares of the 12 constituents were simply divided by 12. As such those shares with the highest prices had the greatest influence on the movements of the index as a whole. In 1916 the Dow 12 became the Dow 20 with four companies being removed from the original twelve and twelve new companies being added. In October, 1928 the Dow 20 became the Dow 30 but the calculation of the index was changed to be the sum of the value of the shares of the 30 constituents divided by what is known as the Dow Divisor.
While the inclusion of the Dow Divisor may have seemed totally straightforward it was – and still is – anything but! Why so? Because every time the number of, or specific constituent, companies change in the index any comparison of the new index value with the old index value is impossible to make with any validity whatsoever. It is like comparing the taste of a cocktail of fruits when the number of different fruits and their distinctive flavours – keep changing. Let me explain the aforementioned as it relates to the Dow.
The False Appreciation of the Dow Explained
On the other hand, companies in the take-off or acceleration phase are added to the index. This greatly increases the chances that the index will always continue to advance rather than decline. In fact, the manner in which the Dow index is maintained actually creates a kind of pyramid scheme! All goes well as long as companies are added that are in their take-off or acceleration phase in place of companies in their stabilization or degeneration phase.
On October 1st, 1928, when the Dow was enlarged to 30 constituents, the calculation formula for the index was changed to take into account the fact that the shares of companies in the Index split on occasion. It was determined that, to allow the value of the Index to remain constant, the sum total of the share values of the 30 constituent companies would be divided by 16.67 ( called the Dow Divisor) as opposed to the previous 30.
On October 1st, 1928 the sum value of the shares of the 30 constituents of the Dow 30 was $3,984 which was then divided by 16.67 rather than 30 thereby generating an index value of 239 (3984 divided by 16.67) instead of 132.8 (3984 divided by 30) representing an increase of 80% overnight!! This action had the affect of putting dramatically more importance on the absolute dollar changes of those shares with the greatest price changes. But it didn’t stop there!
On September, 1929 the Dow divisor was adjusted yet again. This time it was reduced even further down to 10.47 as a way of better accounting for the change in the deletion and addition of constituents back in October, 1928 which, in effect, increased the October 1st, 1928 index value to 380.5 from the original 132.8 for a paper increase of 186.5%!!! From September, 1929 onwards (at least for a while) this “adjustment” had the affect – and I repeat myself – of putting even that much more importance on the absolute dollar changes of those shares with the greatest changes.
How the Dow Divisor Contributed to the Crash of ‘29
From the above analyses/explanation it is evident that the dramatic “adjustments” to the Dow Divisor (coupled with the addition/deletion of constituent companies according to which transition phase they were in) were major contributors to the dramatic increase in the Dow from 1920 until October 1929 and the following dramatic decrease in the Dow 30 from then until 1932 notwithstanding the economic conditions of the time as well.
Dow Jones Industrial Index is a Hoax
In many graphs the y-axis is a fixed unit, such as kg, meter, liter or euro. In the graphs showing the stock exchange values, this also seems to be the case because the unit shows a number of points. However, this is far from true! An index point is not a fixed unit in time and does not have any historical significance. An index is calculated on the basis of a set of shares. Every index has its own formula and the formula gives the number of points of the index. Unfortunately many people attach a lot of value to these graphs which are, however, very deceptive.
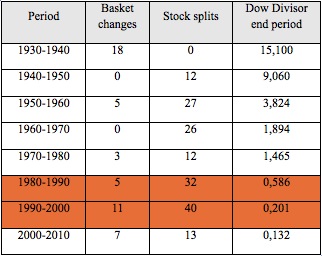
An index is calculated on the basis of a set of shares. Every index has its own formula and the formula results in the number of points of the index. However, this set of shares changes regularly. For a new period the value is based on a different set of shares. It is very strange that these different sets of shares are represented as the same unit. In less than ten years twelve of the thirty companies (i.e. 40%) in the Dow Jones were replaced. Over a period of sixteen years, twenty companies were replaced, a figure of 67%. This meant that over a very short period we were left comparing a basket of today’s apples with a basket of yesterday’s pears.
Even more disturbing is the fact that with every change in the set of shares used to calculate the number of points, the formula also changes. This is done because the index, which is the result of two different sets of shares at the moment the set is changed, must be the same for both sets at that point in time. The index graphs must be continuous lines. For example, the Dow Jones is calculated by adding the shares and dividing the result by a number. Because of changes in the set of shares and the splitting of shares the divider changes continuously. At the moment the divider is 0.15571590501117 but in 1985 this number was higher than 1. An index point in two periods of time is therefore calculated in different ways:
Dow1985 = (x1 + x2 +..+x30) / 1
Dow2014 = (x1 + x2 +.. + x30) / 0.15571590501117
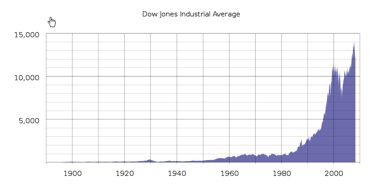
In the 1990s many shares were split. To make sure the result of the calculation remained the same both the number of shares and the divider changed. An increase in share value of 1 dollar of the set of shares in 2014 results is 6.4 times more points than in 1985. The fact that in the 1990s many shares were split is probably the cause of the exponential growth of the Dow Jones index. At the moment the Dow is at 16,437 points. If we used the 1985 formula it would be at 2,559 points.
The most remarkable characteristic is of course the constantly changing set of shares. Generally speaking, the companies that are removed from the set are in a stabilization or degeneration phase. Companies in a take off phase or acceleration phase are added to the set. This greatly increases the chance that the index will rise rather than go down. This is obvious, especially when this is done during the acceleration phase of a transition. From 1980 onward 7 ICT companies (3M, AT&T, Cisco, HP, IBM, Intel, Microsoft), the engines of the latest revolution and 5 financial institutions, which always play an important role in every transition, were added to the Dow Jones.
Table 1. Changes in the Dow, stock splits and the value of the Dow Divisor after the market crash of 1929
Figure 2. Exchange rates of Dow Jones during the latest two industrial revolutions
During the last few years the rate increases have accelerated enormously.
Overview from 1997 : 20 winners in – 20 losers out, a figure of 67%>
September 23, 2013: Hewlett – Packard Co., Bank of America Inc. and Alcoa Inc. will replaced by Goldman Sachs Group Inc., Nike Inc. and Visa Inc. Alcoa has dropped from $40 in 2007 to $8.08. Hewlett- Packard Co. has dropped from $50 in 2010 to $22.36.
Bank of America has dropped from $50 in 2007 to $14.48. But Goldman Sachs Group Inc., Nike Inc. and Visa Inc. have risen 25%, 27% and 18% respectively in 2013.
September 20, 2012: UnitedHealth Group Inc. (UNH) replaces Kraft Foods Inc. Kraft Foods Inc. was split into two companies and was therefore deemed less representative so no longer suitable for the Dow. The share value of UnitedHealth Group Inc. had risen for two years before inclusion in the Dow by 53%.
June 8, 2009: Cisco and Travelers replaced Citigroup and General Motors. Citigroup and General Motors have received billions of dollars of U.S. government money to survive and were not representative of the Dow.
September 22, 2008: Kraft Foods Inc. replaced American International Group. American International Group was replaced after the decision of the government to take a 79.9% stake in the insurance giant. AIG was narrowly saved from destruction by an emergency loan from the Fed.
February 19, 2008: Bank of America Corp. and Chevron Corp. replaced Altria Group Inc. and Honeywell International. Altria was split into two companies and was deemed no longer suitable for the Dow. Honeywell was removed from the Dow because the role of industrial companies in the U.S. stock market in the recent years had declined and Honeywell had the smallest sales and profits among the participants in the Dow.
April 8, 2004: Verizon Communications Inc., American International Group Inc. and Pfizer Inc. replace AT & T Corp., Eastman Kodak Co. and International Paper. AIG shares had increased over 387% in the previous decade and Pfizer had an increase of more than 675& behind it. Shares of AT & T and Kodak, on the other hand, had decreases of more than 40% in the past decade and were therefore removed from the Dow.
November 1, 1999: Microsoft Corporation, Intel Corporation, SBC Communications and Home Depot Incorporated replaced Chevron Corporation, Goodyear Tire & Rubber Company, Union Carbide Corporation and Sears Roebuck.
March 17, 1997: Travelers Group, Hewlett-Packard Company, Johnson & Johnson and Wal-Mart Stores Incorporated replaced Westinghouse Electric Corporation, Texaco Incorporated, Bethlehem Steel Corporation and Woolworth Corporation.
Real truth and Fictional truth
Is the number of points that the Dow Jones now gives us a truth or a fictional truth? If a fictional truth then the number of points now says absolutely nothing about the state that the economy or society is in when compared to the past. In that case a better guide would be to look at the number of people in society that use food stamps today – That is the real truth
https://www.investopedia.com/articles/investing/010917/opinion-dow-stupid.asp
Discover What Makes the Dow Jones Industrial Average Stupid
By DAVID FLOYD
Updated Jun 25, 2019
When the Dow Jones Industrial Average crossed the 20,000 mark in January 2017, the media went wild and the president celebrated with a tweet. When it ground out another 25% to hit 25,000 on Jan. 4, 2018 – less than a year later – the cycle repeated itself. When the index dropped 4.6% to 24,344 on Feb. 5, you would have thought the sun had enveloped the earth.
To be sure, the stock market shot up in 2017, and to be sure, the recent plunge was steep. But we shouldn't describe market milestones or calamities in terms of the Dow (DJI). It's just not a good index.
AAPL) is there, sure. It joined in March 2015, a seemingly arbitrary time, since it had already been the world's biggest company on-and-off for four years. The second- and fourth-biggest companies, Alphabet Inc. (GOOG, GOOGL) and Amazon.com Inc. (AMZN), are nowhere to be seen, but number three Microsoft Corp. (MSFT) is, arbitrarily, there.
According to S&P Dow Jones Indices, which owns the Dow, "a stock typically is added to the index only if the company has an excellent reputation, demonstrates sustained growth and is of interest to a large number of investors. Maintaining adequate sector representation within the indices is also a consideration in the selection process." The components are not, however, chosen according to "quantitative rules."
Choosing blue-chips based on subjective criteria is forgivable, even if choosing only 30 of them might not be. It's what the Dow does next that makes it an inadequate gauge of market performance. The index is price-weighted: for every $1 one of its stocks goes up, the Dow goes up 6.89 points (the Dow divisor, which is used to keep stock splits from throwing the index off even further, yields that ratio).
Volume 75%
1:11
[paste:font size="3"]Schwab's Terri Kallsen on Dow 20k
In other words, stocks with higher prices affect the index more, whatever their actual value as measured by market capitalization. At close on Jan. 3, Goldman Sachs Group Inc. (GS) was a $96.2 billion company by market cap with a per-share price of $253.29. Apple was an $894.0 billion company with a per-share price of $172.23. Apple is over nine times more valuable than Goldman, but the Dow gives Apple around two-thirds the weight it gives Goldman.
The result is that the Dow sometimes moves in the opposite direction to the S&P 500, another S&P Dow Jones index, which is capitalization-weighted and has 500 (well, 505) components. On Dec. 1, 2016, for example, the Dow gained 0.36%, while the S&P 500 fell 0.35%. If you had any interest in actually knowing how the market did on that day, you would look at the S&P 500 and realize that it was modestly down. If you were watching or listening to a non-specialist news broadcast, you'd be liable to hear that the Dow was up 68 points – sounds good, whatever that means. In other words, conflating the Dow with "the stock market" is stretching it.
An even worse practice is citing stock market gains or losses in terms of the Dow's points. The 1,175-point drop on Feb. 5 was not the largest drop in the history of the index by any (sensible) measure. Sure it sounds a lot bigger than the 508-point drop on Black Monday (Oct. 19, 1987) – but that was a 22.6% plunge, while the seemingly steeper 1,175-point drop only amounted to a 4.6% loss. And besides, the S&P was down 4.1%. Go with that.
Why the discrepancy between the Dow and the S&P? The Goldman-Apple example gives a hint: Goldman Sachs gained 3.3% on Dec. 1, 2016. Apple fell 0.9%. The S&P takes that information and concludes, "Goldman Sachs added around $3 billion in value to the market; Apple subtracted around $6 billion from it." The Dow? "Goldman Sachs went up $7.34 per share, so let's say it added around 50 points to the market; Apple went down $1.03 per share, so it subtracted around 7 points." (Note that the divisor has changed since these figures were calculated.)
If that seems logical, we've got a SPDR Dow Jones Industrial Average ETF (DIA) to sell you.
What Can You Do?
David Blitzer, managing director and chairman of the index committee at S&P Dow Jones Indices, told Investopedia in January 2017, "There's certainly a lot of times when I'm as surprised as anyone else with how much coverage the Dow gets." Confronted with the issues caused by its tiny number of components and price-weighted methodology, he directed us to his company's other famous product, the S&P 500: it "doesn't have all the issues you just described." He added that professional investors and market analysts prefer the S&P 500, "but the Dow is the one that's all over the newspapers." (The Wall Street Journal, which Charles Dow co-founded in 1889, blared "Dow Hits 22000, Powered by Apple" – which isn't even a multiple of 5,000 – on Aug. 3.)
Blitzer provided some insight into the process of choosing the index's components. Because the Dow has long been accompanied by sister indices tracking transportation and utilities, it does not include companies from those sectors. Until the 1980s, the "industrial" moniker was more or less accurate, but then it was decided that the index would include banks, insurers, restaurant chains and other non-industrial companies – but not utilities or transportation. Blitzer also revealed a fudge the selection committee uses to avoid some of the price-weighted methodology's worst pitfalls: the ratio of the highest stock price to the lowest should be less than 10 to 1 (which may explain why Alphabet and Berkshire Hathaway are excluded).
Blitzer appears to accept the issues with the Dow. He said that the committee has discussed switching to a capitalization-weighted approach. But "you'd just use the S&P 500 at that point" and, he added, "we'd be throwing away a lot of history."
Therein lies the rub. Fixing the Dow's problems would make it tough to distinguish from the more sensible indices that are already out there. In the process it would cut off a metric that, however flawed, can be traced continuously for 120 years – not to mention throwing away an internationally recognized brand. "Why do we keep it?" Blitzer laughed as he repeated the snide reporter's question. "The recognition, the publicity, the long history."
"To be honest," he added, "this is not a hugely expensive index to maintain."
If it's too broke to fix, don't. On the other hand, it's probably not wise to pay too much attention to it either.
...
"...The most remarkable characteristic is of course the constantly changing set of shares. Generally speaking, the companies that are removed from the set are in a stabilization or degeneration phase. Companies in a take off phase or acceleration phase are added to the set. This greatly increases the chance that the index will rise rather than go down. This is obvious, especially when this is done during the acceleration phase of a transition. From 1980 onward 7 ICT companies (3M, AT&T, Cisco, HP, IBM, Intel, Microsoft), the engines of the latest revolution and 5 financial institutions, which always play an important role in every transition, were added to the Dow Jones..."
Sounds familiar.
Like why companies on any old exchange get delisted once they fall below a certain value?
It is what it is. It doesn't mean it is fraudulent, does it? How come the SP, NASDAQ and RUSSEL all keep going up over time, too?
I have written why here a couple times.Since Vanz has made it abundantly clear that I am not allowed to post a response to his post, then I will ask the rest of the audience, who wishes to have a discussion about it...
Why is the DOW the biggest "scam" on earth? It's just an index, like every other index. What is the big scam with the DJIA 30, and the Global Dow 150? They are weighted differently, yes...How is an index a "scam"?
Its 30 stocks. The Dow that is.
Let me see if I can find a link.
I have written why here a couple times.
Its 30 stocks. The Dow that is.
Let me see if I can find a link.
@ph1l Posted a thorough article about it just above this, at https://www.nakedcapitalism.com/2014/05/the-dow-jones-industrial-average-is-a-hoax.html
If that is the gist of it, then it is just maths, and causes me to *shrug* and think, "Go with the flow".
Hell, there's a ton of scam in these markets if you look deep enough. HFT, dark pools and the like. We just roll with it.
Here. From 2017.I have written why here a couple times.
Its 30 stocks. The Dow that is.
Let me see if I can find a link.
If you can't see it without me having to expound upon this simple outline, you need to get out of the game. Read it twice and read it slow. And then think.
Its all controlled short term. It really is.
I bet money they know exactly where the Dow will close at the end of each month going forward for at least the next 6 months.
The DJIA is comical. It really is the leader of the band; .... and its the most easy to manipulate. You have 30 stocks that they can control with algy's that know when, and how much to buy of any given component(s) at any given instant to move that f'r any direction by any number of points.
Pretty easy when you manage billions and billions of dollars and the trading house down the street that also manages billions and billions of dollars is run by those in your elite circles. Sure there's divergence between the averages sometimes, yesterday was a good example, but if the Dow jumps 300 points, somehow or the other the Naz and S&P will find a way to follow. They always have. Same goes for sell-offs.
Its 30 stocks controlled by billions of dollars in buying power that also have the computing power of 30 NASA's combined.
And it leads the worlds headlines nightly.
That's why its a f'n scam buddy. Because it can be controlled with zero dollars lost when you have that ability. Its like the greatest radio station of all time. One station that that sets the tone for the entire world's markets. At least 80% of the time.
Its the biggest scam of all time.
Last edited:
...
And it leads the worlds headlines nightly.
Questions now?
It leads the headlines because old habits die hard.
No, I have no questions.
- Status
- Not open for further replies.