YM is up 0.76%,
NQ is up 1.43%
ES is up 0.72%
Something is wrong with this picture.
NQ is up 1.43%
ES is up 0.72%
Something is wrong with this picture.
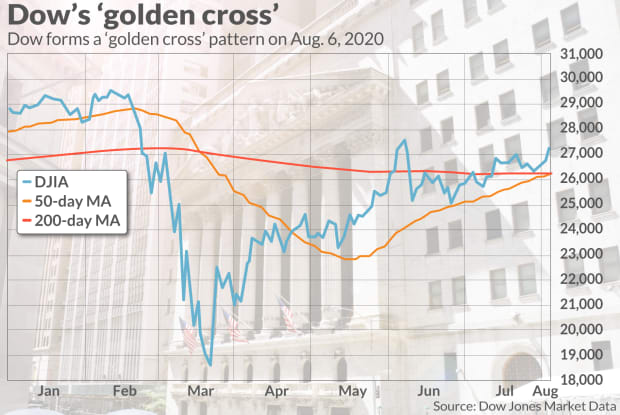
A bullish ‘golden cross’ is forming in the Dow industrials
Last Updated: Aug. 6, 2020 at 3:53 p.m. ET First Published: Aug. 6, 2020 at 3:00 p.m. ET
By Mark DeCambre
https://www.marketwatch.com/story/a...the-dow-industrials-11596740412?mod=home-page
The last time a golden cross formed in the Dow was March of 2019
I don't believe too much in this shit...but anyway...
I'm bullish atm.
Yeah, I luv flantasticool testicle indicators.More like a Golden Shower for the Bears ... .
")
Long 23 stop 20 1/4 size last trade of day looking for runner
That timing is impressive. I actually got out of my long at 3324 since it was the top of the range we have been in since yesterday and because the bearish trendline above was around 3326.
Was it the fact that we had a failed bearish breakout below the range that made you confident to long into resistance?
Anyway: nice call!