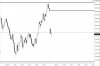
And for your monochromatic viewing pleasure my RTH ES 5 minute chart. The three solid lines at the High and low of this week's RTH range thus far, and also yesterday's close.
The dotted black line is the HWB of the entire RTH range for the week thus far ...
The dotted black line is the HWB of the entire RTH range for the week thus far ...