Well make no mistake, we're going lower. It'll be creep,creep, bam. Followed by a large up-spike. Followed by more downward bias.Vanz, why can't you accept the fact that the bear market on the major three indices started the moment they were created? I just CANNOT understand how you do not have the vision of the bears on this forum, who seem to KNOW, with prescience, that these markets will all tank to a negative number.
WE know that is impossible. But the bear market gurus know, somehow, that it is inevitable.
You are using an out of date browser. It may not display this or other websites correctly.
You should upgrade or use an alternative browser.
You should upgrade or use an alternative browser.
ES Journal - 2019/2020
- Thread starter Buy1Sell2
- Start date
- Status
- Not open for further replies.
extremely complex with 3 levels of fibonacci projections....making analysis nearly impossible
super analytical and academic.
Conflicting perception of the guys... Fibonacci is as good as astrology in analysis, if that's what these guys are using then they are neither super analytical nor academic... no wonder you saw some wildly wrong forecasts
Every grate trader of our times, at least the successful ones, always say "keep it simple"
Last edited:
Well make no mistake, we're going lower. It'll be creep,creep, bam. Followed by a large up-spike. Followed by more downward bias.
Oh nos! Will we ever go up again, or is this the bear market that started in (what was it, March 2019 that is being declared), which nobody saw last year from October to December 2018, but turned out to be a fluke? WHoopsie daisy! Yes, I think the best time to buy an equity index would be when the VX reading goes to 2.
I LIKE my call!
Um... not that it matters, but meager a gander at the second chart I presented in this post. https://elitetrader.com/et/threads/es-journal-2019-2020.328086/page-1143#post-4921870Fibonacci is as good as astrology in analysis, if that's what these guys are using then they are neither super analytical nor academic... no wonder you saw some wildly wrong forecasts
"
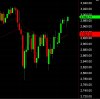
I didn't mention it, no one probably noticed it.... but those lines, you can only see the one, had been sitting there for a few weeks. The -61.8 line. 2988
That turned out to be pretty much exact. Just sayin. Might have been luck. Magic pencil. Who knows.
Edit, here ya go. I have not touched a thing on this particular chart in weeks. 8/5 to be exact. That big red candle is when I set it.
Last edited:
Um... not that it matters
Who else on here uses Fibonacci to trade?
I'm not knocking the guy... was brilliand and super intelligent to notice the repeating sequence in nature, but really, apply nature's algoes to the stock market? I should point out that 90% of female traders use Fibonacci extensions, and, statistics say, females, on average, have a better win rate, so who knows? caution v testosterone-induced risky behaviour or Fibonacci?
Here is example of what news flow does to the market.why do you think the sudden moves are news related, i never really understood that. if market moved more than 30-40 points within a short span of time then that would be news related, rest price is not random, it moves according to the TA. especially PA. I have observed any time price moves outside its path, then there are certain orders in play that put the price back on track. I would not call the down move @ open and the upmove @ noon news worthy moves. That is just my take on it. For me when price really moves more than 30-40 points within a short period of time that would be news related and collective forces at play to take advantage of the news.
US-China news, again. This has been going on for quite some time now.
The move higher was clean through resistance/offers sitting around 2980.50
I'm not sure you realise this tenny, but news can create sentiment, either good or bad. You can lean on this sentiment for hours, sometimes days.
I don't know about you, but I much rather know why prices a punching in a set direction (particularly if there is a reason) than just sitting there watching and not really knowing why.
Little bit more, So here we are about to set another all time high......and whats the FOMC going to do, cut rates again. Powell is terrified of Trump and will kowtao to him.
Attachments
I found the study of EW very interesting and really enjoyed the Prechter-Frost book. The problem with EW is it contains the need to be exact in wave counts and fib constraints. Fractal geometry was developed to approximate a mathematical description of an irregular surface. Price development exhibits such irregular behavior and does not lend itself to exact mathematical descriptions.Guys - I'll be posting here more often as I recently left the ElliotwaveTrader forums.: https://www.elliottwavetrader.net
I learned a lot from that site, but bottomline, the forecasting time-frame was not conducive to mine.
They would sometimes go out 12-18 months with their forecasts. On top of that, there were some wildly
wrong forecasts made. Many of the analysts on that site were super analytical and academic.
The charts they produced were like works of art....and extremely complex with 3 levels of Fibonacci projections....making analysis nearly impossible.
Last edited:
All of the "alternate" counts really got to me. There was always a second version of the next move.....so 50-50 at best for a good prediction. And the counts could change daily....making it a full-time job just to keep up with the changes.I found the study of EW very interesting and really enjoyed the Prechter-Frost book. The problem with EW is it contains the need to be exact in wave counts and fib constraints. Fractal geometry was developed to approximate a mathematical description of an irregular surface. Price development exhibits such irregular behavior and does not lend itself to exact mathematical descriptions.
- Status
- Not open for further replies.