This is what I like to see, a rising mkt with rising VIX. Added more at 22 with avg now at 10
Covered some at 2598. Back down to 1/3 of max position and will add back on retracement during RTH. I am expecting a move down today at least to 83.
This is what I like to see, a rising mkt with rising VIX. Added more at 22 with avg now at 10
Certainly was a short term sell signal on futures. We have not seen that on cash,
I was referring to the daily cash chart that we have not seen a reversal down yet. Thus, for now, I believe the selloff you referenced from 5 min chart is just pullback-----and I like pullbacks!I used the cash chart. Anyway, here we are 20 pts lower since I posted...
Why so bullish B1?I was referring to the daily cash chart that we have not seen a reversal down yet. Thus, for now, I believe the selloff you referenced from 5 min chart is just pullback-----and I like pullbacks!
Daily chart is bullish. --I really don'y pay attention to news. It's too much info and is easily interpreted incorrecty.Why so bullish B1?
Today alone we have Taiwan Semi guiding their forward revenues down significantly from previous estimates. PPG's revenues were in line but still down YOY.
FUL which is a great barometer of residential and commercial construction in both domestic and international markets, had a horrible miss.
I know long term history agrees with you on the general direction being up, but what is your timeframe here? Days, months, or years? Years I agree. Days/months... maybe not so much.
Thoughts?
Covered some at 2598. Back down to 1/3 of max position and will add back on retracement during RTH. I am expecting a move down today at least to 83.
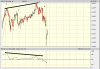
Yes--and I did see that but it was counter to the daily so I disregarded it for the overall bullish bias and considered it to be a setup for pullback overnight. It was a great short term signal.Here is the chart I was talking about. 1-2 are the morning, 3-4 are the afternoon double tops. The RSI divergence is very noticeable.