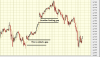
The SMA line on the daily will be the barrier for further up. It is around 2728ish...
Funny thing happened to the Broadway, anybody seen the high of the day? Yeap, 2730.89, currently a good 15 points below...

The SMA line on the daily will be the barrier for further up. It is around 2728ish...
The bars that I pictured were cash bars. Gaps are looked at on cash, not futures. You'll notice that the "gap" you described was just all price points that were explored on 2/22 on cash. No gap exists. It's of course fine for you to use any criteria you wish for gaps, that is your prerogative. ----No gap occurs though when the "gap" was prices that had printed the day before.If you talk about futures, but who cares about the futures when cash gap is the one that attracts price? Just like the last 12 hours, just because we closed the gap overnight that didn't mean the cash wouldn't want to do it too in RTH.
Not long yet. I am looking for a trade that will have legs.I'm beginning to be somewhat interested here at 2720 in a long. Not entering yet.
This is False. I post losses all the time. There are a couple of others in this thread that do as well---beyond that, who else on the board does that?Anyhow you never admit you are wrong
How does pricing overlap when there's 11 points difference that's not overlapping ?It's up to you of course to call a gap as you see it. I am just saying, it's an insignificant anomaly because pricing during the 2 days overlaps.
I only see one cropped chart pictureBoth bars are pictured left and right.---on all 3 chartings I posted.
It's very significant because it becomes a magnet for a reversal area once filledGo ahead and call it a gap. It's not.----It's insignificant at best.
There are 3 cropped pictures. All have more than one bar in them.I only see one cropped chart picture