You are using an out of date browser. It may not display this or other websites correctly.
You should upgrade or use an alternative browser.
You should upgrade or use an alternative browser.
ES Journal - 2017/2018
- Thread starter Buy1Sell2
- Start date
- Status
- Not open for further replies.
@Spectre2007 How about some annotations on each chart if possible? Would like to know what I am looking at. A bit of a line overload for me... Thanks.
@Spectre2007 How about some annotations on each chart if possible? Would like to know what I am looking at. A bit of a line overload for me... Thanks.
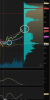
its riding the line on the daily. Shorter timeframe charts looking for pop higher..vol profile on side.. shows equilibrium levels.. and outliers at the narrow points of bell curves. Outliers (narrow points) on bell curves is where entries should occur.
Narrow point of bell curve(outlier) combined with a line break or adherence confirms a high probability entry where price has slippage into the next equilibrium level. Quiet markets tend to drift up, and mix in the low vol trade.. higher probability for long entries.
Last edited:
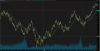
Short 79.75, stop trigger 85
Orderflow slippage times.. 2:00am (European open) 10:30am (bankers from hamptons get settled into desk) ....2:00pm (post lunch clean up trades)..
Short 79.75, stop trigger 85
closest outlier at tick level(line)
Attachments
Looks like they've got the downside out of their systems now. Hopefully back to business as usual!
- Status
- Not open for further replies.