You are using an out of date browser. It may not display this or other websites correctly.
You should upgrade or use an alternative browser.
You should upgrade or use an alternative browser.
ES Journal - 2014
- Thread starter murica
- Start date
97 75 bid for reduce reduced 98... \
add 2003.5 avg 2001 .75add 99.5 add 2001 avg 98 5/8
add 03
Last edited:
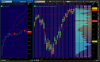
ears perk up...chart?Down day in the making ? Expanded volatility wide range bar on the 5 min. Getting short now
ears perk up...chart?
pretty simple. Always measure the level of volatility @ the open. I use the first 10 mins and use the range of the 5 min bars as my measurement. When u see a 5 min wide-range-bar down that is much bigger than any down bar of the past few days, I begin my down trend template. If you do some research and backtest this phenomenon, its actually very reliable.