You are using an out of date browser. It may not display this or other websites correctly.
You should upgrade or use an alternative browser.
You should upgrade or use an alternative browser.
ES Journal - 2014
- Thread starter murica
- Start date
You've got 5 shorts from QQQ 86. When does your demo-broker capitulate and liquidate your fake positions?
rofl!

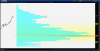
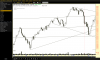
spx 1 mo profile
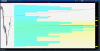
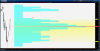
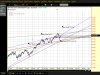
spx daily trendlines. dow did not hit the left shoulder, russ 2k did, ndx 52 week high.
maybe this is all just a way to skew my thinking and i very well know mkts overshoot.
options exp next week. crazy things can happen.
Attachments
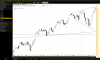
spx daily trendlines. dow did not hit the left shoulder, russ 2k did, ndx 52 week high.
maybe this is all just a way to skew my thinking and i very well know mkts overshoot.
options exp next week. crazy things can happen.
You know Mast it seems to me since both SPX and ES weekly options have become so popular those "normal" monthly gyrations on OP /ex week have tamed down a bit. Most likely we will be sub 14 on the VIX next week so Ive resumed a slightly bullish bias...more long calls and short puts. Im short 1 little ES at 31 so plan to sell a 25 or 30 put against it and "hope" we dont hit 60!
spx gap is 1844.86 from jan 22
spy is 184.3
spy is 184.3
Hi everyone! If I'm not mistaken, 38's completes an RTH gap fill from before the big selloff. Although it doesn't seem like many of you were long today, this seems like a great place to take profit if you are.
Long 1831
------------
i've been told 1837 area should print, so that's what i'm waiting for to close the latest long
and there's the 37 print
--------------------------------------------------------
Told by whom ?
One of my reliable sources who occasionally throws me a bone

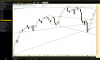
dow...........................
About the only thingz I can see in those charts are:
1. Price seems to move in streaks of upward or downward bias
2. On a longer time frame, price seems to move inside a channel
Everything else looks random :eek:
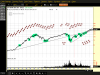
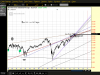
1st 2 show where the lines came from, last one is a reduced version showing we hit the line from 2000 and 2007 highs at new years(res because it held) the line from 09 low and line from 02 low intersecting at fridays top,the line from 1937 ,broke above in 95,served as supp in 02/03,broke and crashed in 08 ,came back above in mar 13.comes in at 15170 area for a target,the last chart shows a left shoulder , a head and possibly a right shoulder forming...distribution?About the only thingz I can see in those charts are:
1. Price seems to move in streaks of upward or downward bias
2. On a longer time frame, price seems to move inside a channel
Everything else looks random :eek: