You are using an out of date browser. It may not display this or other websites correctly.
You should upgrade or use an alternative browser.
You should upgrade or use an alternative browser.
ES Journal - 2014
- Thread starter murica
- Start date
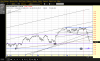
when rising market looks for sellers,usually at resistance, when dropping it looks for buyers, usually at support,it shows supp lower so for this to be a low,you would need supp in transports or spx or nasdaq or some of the currencies,but for dow alone support is much lowerammo, thks for your chart. would you pls explain what you believe it shows? thnks
so buyers here are likely not going to be in large numbers and not likely to tag the low
when it does get there you need to see demand/buyers ,or it's not support
when rising market looks for sellers,usually at resistance, when dropping it looks for buyers, usually at support,it shows supp lower so for this to be a low,you would need supp in transports or spx or nasdaq or some of the currencies,but for dow alone support is much lower
so buyers here are likely not going to be in large numbers and not likely to tag the low
when it does get there you need to see demand/buyers ,or it's not support
thnx. i'll pull all these after mrkt close today. i don't use any lines, indicators etc, i trade off my sentiment so i look forward to objective analysis.
we are barnacles on a large ship,market is the ship , we follow ,nice to know where all the ports are that the ship may pull intothnx. i'll pull all these after mrkt close today. i don't use any lines, indicators etc, i trade off my sentiment so i look forward to objective analysis.
reducing here at 76 cashlooking for 90-92 for a reduce,not posted