You are using an out of date browser. It may not display this or other websites correctly.
You should upgrade or use an alternative browser.
You should upgrade or use an alternative browser.
ES Has Bottomed
- Thread starter Buy1Sell2
- Start date
%%Was late at night and wasn't too concerned with grammar.
If you are referring to the moving average on my chart. It's not a moving average of price, rather volume, vwap, poc , etc. I don't use it all the time but is handle go to tool.
That is fine , 4 PipS, this is a traders/investors place, not an english class. SPY, SPXL, UPRO,QQQ..... have closed again above an uptrending 50 day moving average[ + 200DMA] moving average.Its 12:50 CST-NOT a prediction.
Too bad for TGT; TGT is still in a bear market, below 50 dma, below 200 dma, with terrible fundamentals............................................................
%%
That is fine , 4 PipS, this is a traders/investors place, not an english class. SPY, SPXL, UPRO,QQQ..... have closed again above an uptrending 50 day moving average[ + 200DMA] moving average.Its 12:50 CST-NOT a prediction.
Too bad for TGT; TGT is still in a bear market, below 50 dma, below 200 dma, with terrible fundamentals............................................................
I should proof read things better all the same. Just noticed handle should have been handy also. Late nights trading and using two keyboards.
Daily Chart.
Looks like ES is setting up for more downside. ES making lower highs coming into support at 2344 area with an inside daily candle. Be watching the High and Low of yesterday's candle closely .
%%I should proof read things better all the same. Just noticed handle should have been handy also. Late nights trading and using two keyboards.
Daily Chart.
Looks like ES is setting up for more downside. ES making lower highs coming into support at 2344 area with an inside daily candle. Be watching the High and Low of yesterday's candle closely .
Maybe right on ES downside, many sell in May?? But frankly,SPY, SDY, SPXL, UPRO, QQQ are above 50 dma[ SPY 50 day moving ema, is $233.91, based on yesterdays close]
Interesting IBD charts , using simple, slower, 50 day ma, has yesterdays day close[APR 11,2017 of SPY below 50 dma-+/??.NOT a prediction. SPY, SDY, uptrend still looks fine[50day ema]to me , in a tax free account, but many like to sell in May-HEY.
%%Am thinking with everything going on a huge correction is near. S&P downside 1980.
Maybe , it made a clean break thru 50 day moving average;
but looks like a double bottom, on QQQ, SPY, SPXL, UPRO, ES. But looks like TGT going down more; downtrend bear trend
Can't claim victory yet, but looking good here.ES will make new all time highs prior to hitting 2258.00 (June ES pricing is 2336.75)
%%%%
Maybe , it made a clean break thru 50 day moving average;
but looks like a double bottom, on QQQ, SPY, SPXL, UPRO, ES. But looks like TGT going down more; downtrend bear trend
NOT a prediction
%%
NOT a prediction
Thought we were due for a bit of a correction. Then France elections put a rocket into the markets, then Trump's tax plan sent the markets higher again, plus very positive earnings coming from the US also.
Surely looking at the ES daily there has to be a nice short.
Not sure where I will enter to sell but higher the better. Daily candle bearish, double top. See if it proves itself.
Using the fibs on that big daily candle then looking at them on a 5 range chart. 2388.50 looks like a preferred short entry. Resistance during Globex 2385.
Attachments
Last edited:
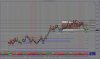
Fibonacci theory is bogus.View attachment 173184
Using the fibs on that big daily candle then looking at them on a 5 range chart. 2388.50 looks like a preferred short entry. Resistance during Globex 2385.