You are using an out of date browser. It may not display this or other websites correctly.
You should upgrade or use an alternative browser.
You should upgrade or use an alternative browser.
Emini S&P 500 expectations.
- Thread starter malaspina
- Start date
hello every trader for emini s&p ... i want to discuss my system that give me every day between 200 to 600 ...without loss for 5 month already and i hope will continues positive
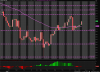
and i posted an example of my strategy
Hello Emini s&p 500, if this system works for you it is all that matters. Congratulations, 5 months without a loss day trading is quite impressive. You are welcome to post here any new trading ideas. Keep the good work!