Earnings Reports by ORATS

Matt_ORATS

Sponsor
We have a new report and video highlighting companies reporting earnings.
The report reviews historical earnings information and finds a potential options trade.
We appreciate feedback.
 
KB Home (KBH) Earnings Report
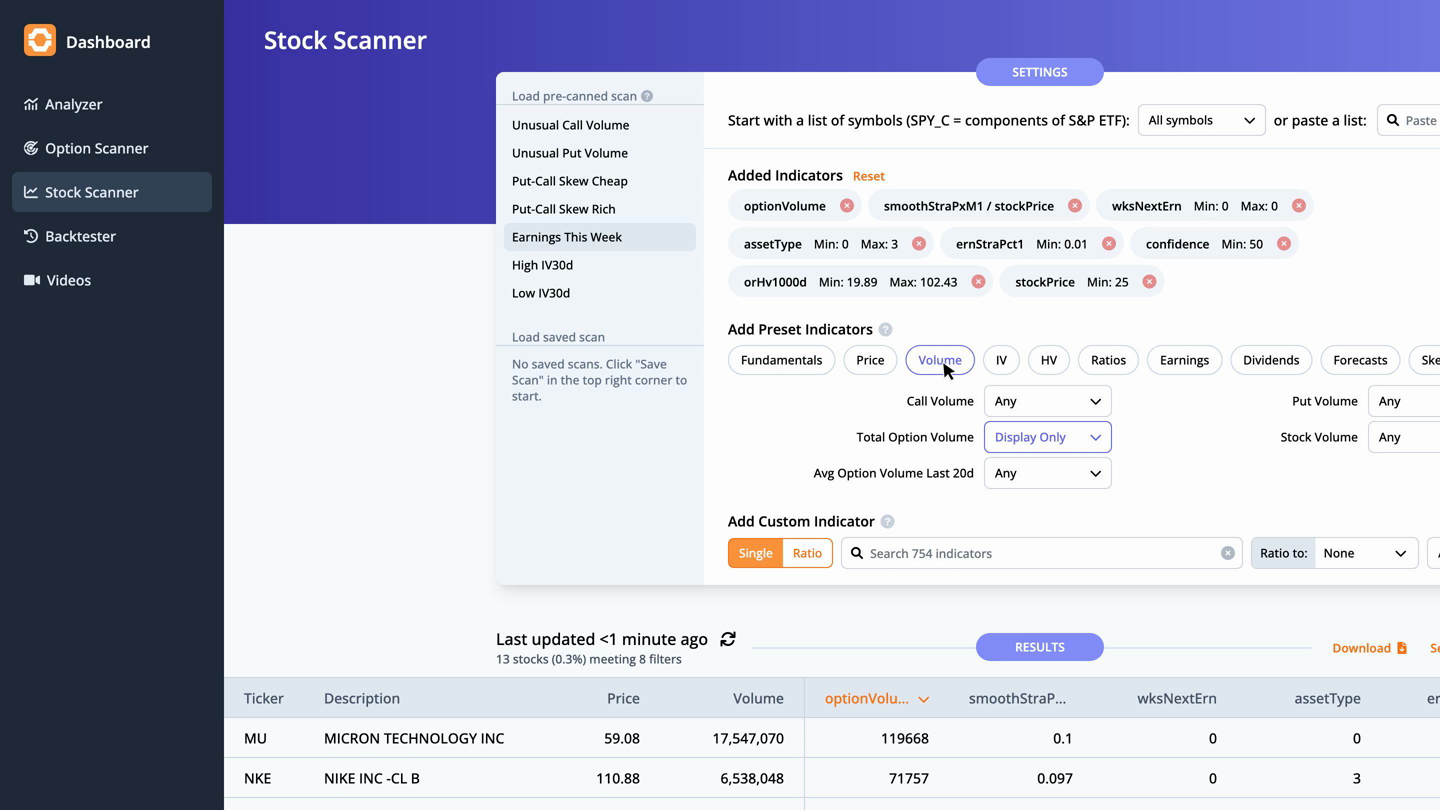
Welcome to the ORATS earnings report where we scan for companies with upcoming earnings announcements, check out historical earnings information, and find a potential options trade. Let's start by running a scan on earnings reporting this week, which includes the total option volume indicator, sorted from greatest to least.


RThQZILDruz6U26usEHMZsqDn5Q5L3Sdf_YvIRXQBiQoTSI7kUlco-qScHNZFw4Jlwu9Cxz9HyRZ-IWyPMNBCweQftzrtaFopeCiFH7O-2h1RU9z3BrW9OL547NEKHb1-TErU4GbnG-MZ6NtXA


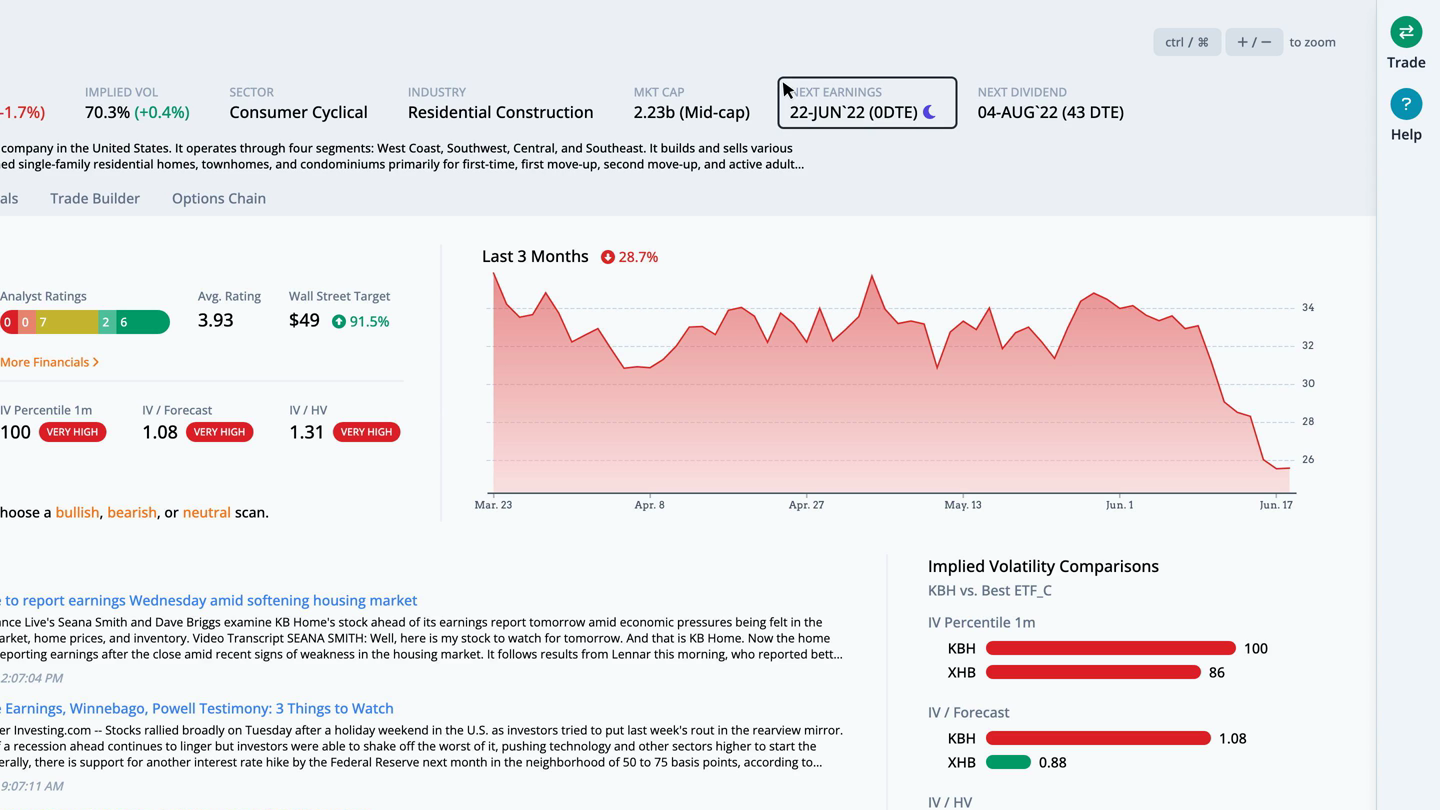
Focusing on KB Home, as we click through, we see this mid-cap company in the residential construction industry reports earnings on Wednesday, June 22, after the close.


OaXWwuBU9b_bEKVjNQSvdbrU2GYlOyp8f25Zr1LWzD9NhDp3P_Arpw3kXt8fvW3q9JxiRfNvh_QQ4Fn-j-oPoEAPqKKDXUCmufiMZc6EWxj9lb_zA2BIZMFqaReS3jNpNa14IcdsG6_Z6bR7GA


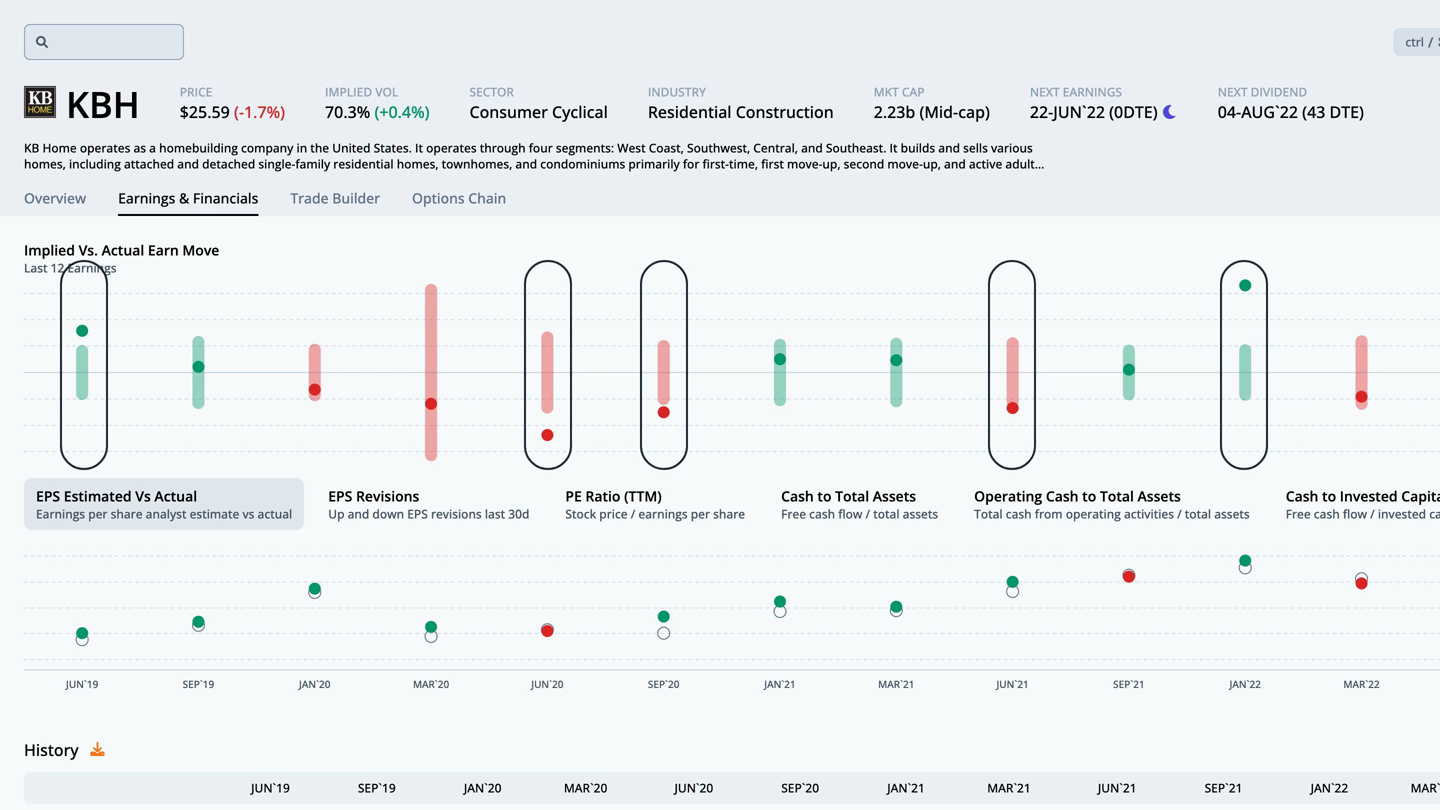
The earnings and financials tab takes us to more detail showing the options market expecting a move of 7.9% in either direction. This move was breached in 2 out of the last 12 earnings.


cFZa8ZfuZVlxupgCUMOc5ZD0hQ_lVBD0tHbykJNrnWeHfVTg648W5yU0OuD0Bhi2ltJNhhFAW32gLaneXqTYZtVi4JEQ5rG6gIGPutjETZVz6gnJg7XFQrCyngnkyCfxIfgKr2fD7fhBLVqy8g


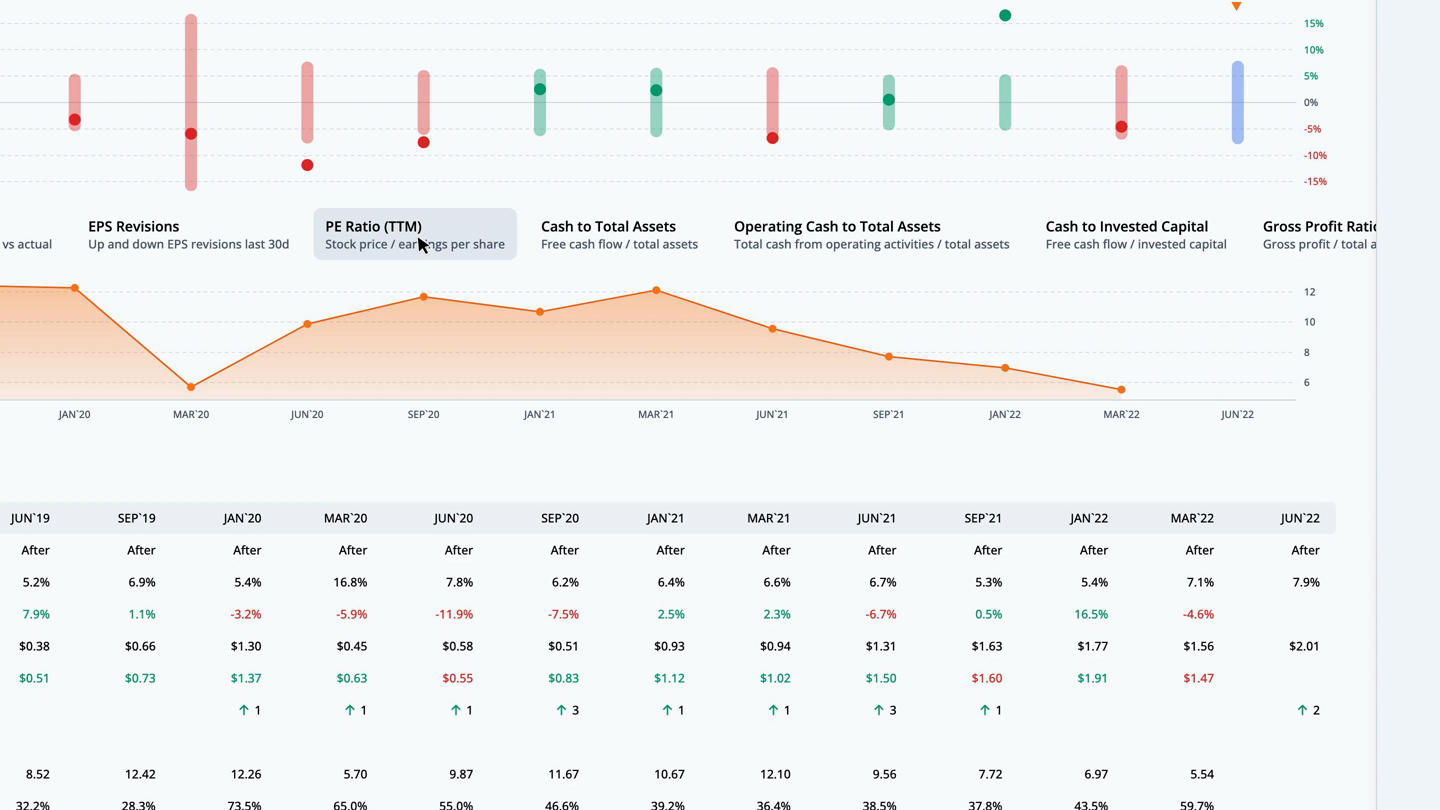
During that time, the post-earnings move was outside of the implied range 5 times. In those cases, long straddles were profitable. The rest of the earnings moves likely yielded profitable short straddles. We can overlay quarterly financial data by clicking on the ratios below the earn move graph. Let's look at the PE ratio, which is the stock price divided by the trailing twelve months earnings per share.


oGK5E5y_i_CzglPHCQ0-aUSU-c1zndkjKchPr6C8FndpvEEBmMUj297e1gHGF2VhRUKOkWjl7qDITtu1iXUsP8wZVS-tH9s90cPnh05uRxz76oDyjApkxplvKbyHvE51vmLFZCUDEgsXG7kQ7A


For KBH, the current PE ratio is 3.9, which is 48.7% under the average for the last twelve earnings observations. Returning to the overview tab, we can quickly run a scan to find the best option trades. Since earnings are right around the corner, we scan for neutral strategies, then filter the scan results by S%, or smoothed edge, by setting it between negative and positive 3%.


AyMqQ0wRo_7p48am4x7es0Mxbq6rwqZjZouGavgcQUQswIEDJIQKcMQYao8IN05dy2L8tSWSDXlJwCVO2O0QFpxDZ7iqwqrKbCtk8opSC1TqMZnPVis9Wl0TTzfDsPqv2ufDo_dniK99YBYA7A


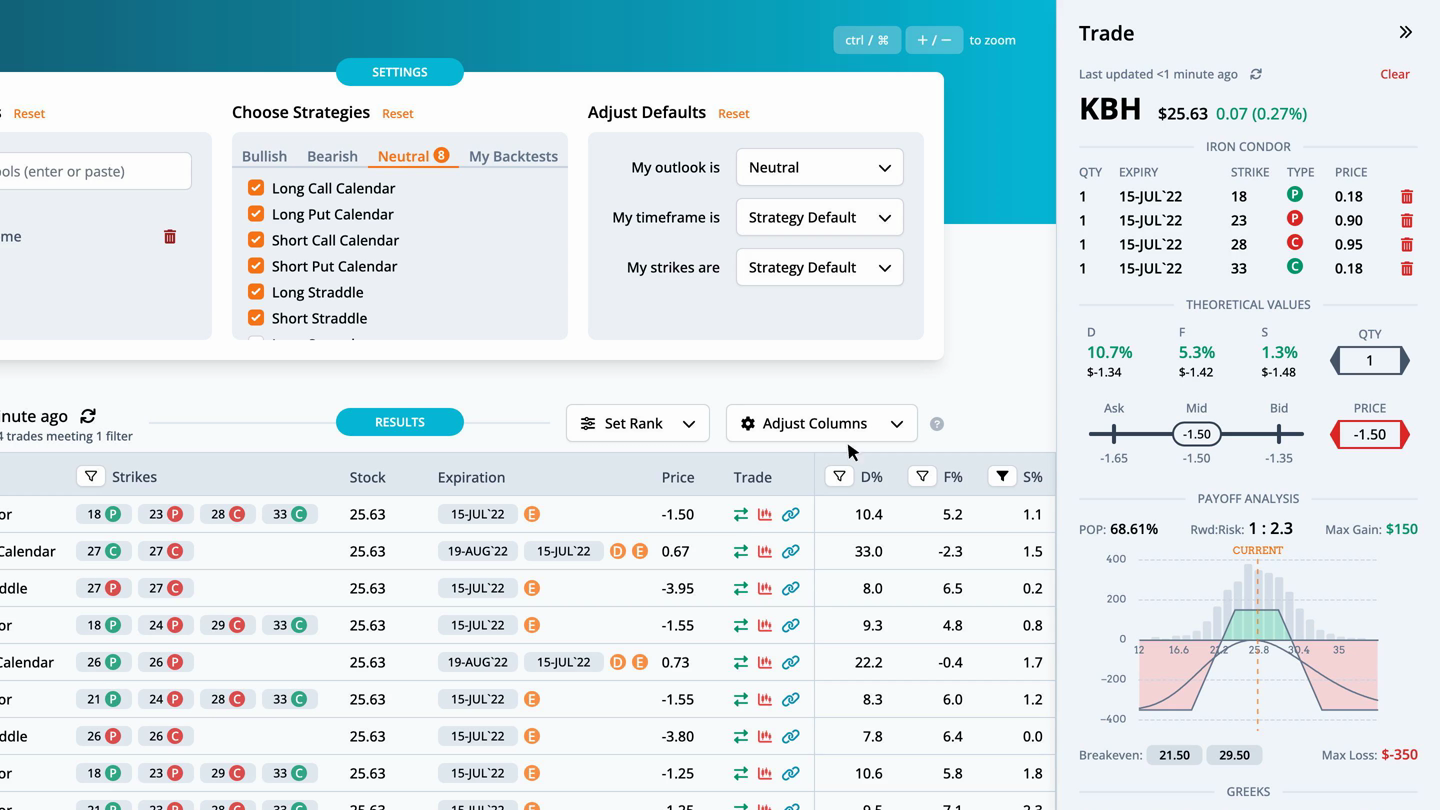
This helps narrow the results to trades that are fairly priced. The highest ranked trade is a Iron Condor with strikes at 18, 23, 28, and 33, expiring on 2022-07-15, for a credit of $1.5.


_G4d8gYB6cw9OR9kT7YQrIUk4Pg-s0qwNDSzSSO3LwfU9w1KyOhMvxVhMvrc4EUkdpVZNMzzM6rliL3IZ6t5Irufjatks6iWi48cnC9OFLFL-zW23Us_V4PKLS6cU85FTwxy0wU-7sXdz1hviw


By pulling up the trade, we can see the theoretical values in more detail. The distribution edge, found by the expected value of the payoff picture on the stock's historical distribution, has an edge of 10.7%. The forecast edge, which is derived from historical volatility, has an edge of 5.3%. Lastly, the smoothed edge, which is calculated by drawing a best fit curve through the monthly implied volatilities, has an edge of 1.3%. The edge is relative to the mid-market price of the trade. Greater positive edges are a theoretical benefit to the trader. We can also look at the payoff graph. The probability of profit sums the probability of the nodes for the part of the payoff picture above the zero profit line over three standard deviations. For this trade the probability of profit is 68.61%. The reward to risk divides the max gain by the max loss. Here the 1 to 2.3 is the ratio of the max gain of $150 to the max loss of $-350. There are two break evens for this Iron Condor at 21.5 and 29.5. The total greeks and ThinkOrSwim code complete the information on the trade analysis popout.


HOoqW0nyK14IWpKR2k8W6_-O2TniiUmVXcgb_554ylFjdFdwTFtnMvz-IidsWphXst-LyeTItRlTGW2DN1Y-1mYq9jNxh5zVya0H46_jcvDiFGPIJ3mJitC6Gt-A2pxVFKl4QcZkgLzFYqZSkw


Next, let's look at this trade in the trade builder. Over the last month, the stock price fell 20.7%, while the thirty-day implied volatility rose 30.5%. The average slope of the trendlines is negative. The heatmap on the right side of the graph is green where volatility and slope are undervalued, and red where they are overvalued. In this case, short term IV and slope are overvalued, while the long term is slightly overvalued.


Os0n55sqZ0943lYH0UOVQkfHmZHr43rNhV5RtsrlYsO5dBy010Q4lawiTa1RrMLbiNx0sfsOiwrJW9uRamApVo4aCm_TXB6k7tbc6tjrrMAdXeGTkmbCPjGoOs0mWbjglRCLL307g5EnfvySKg


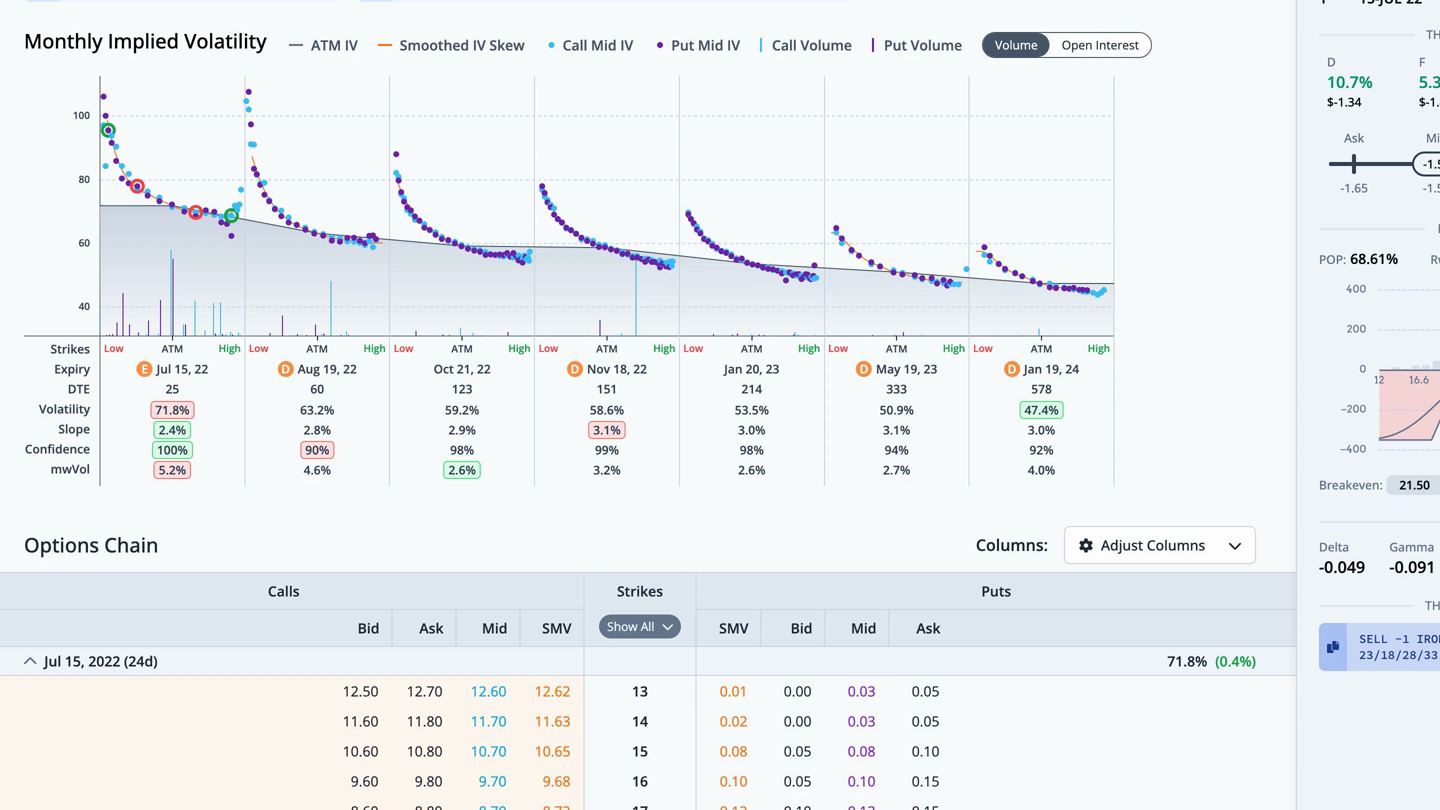
We can also see this trade overlaid on the monthly implied volatility graph in the chain tab. The legs for this trade are circled. For any questions or issues with the article, please contact otto@orats.com. To subscribe to the dashboard, please visit https://orats.com/dashboard.
 
Nike (NKE) Earnings Report

Welcome to the ORATS earnings report where we scan for companies with upcoming earnings announcements, check out historical earnings information, and find a potential options trade.


Read on or watch the video overview here:
.


Let's start by running a scan on stocks reporting earnings this week, which includes the total option volume indicator, sorted from greatest to least.


pJcU5jiLJUFQZIpPblh8U5rapF_4HeqlHPPZH2bMVmxYJ37IDbRhmHlXryh-XHVwA64QVmy03QoVh4cUoVgPId1ugJL9kKJQfzZStdFPG3LBOg48DWOFGe1El7OHhu8yX1Oua2P6Dz0GY9CnRA


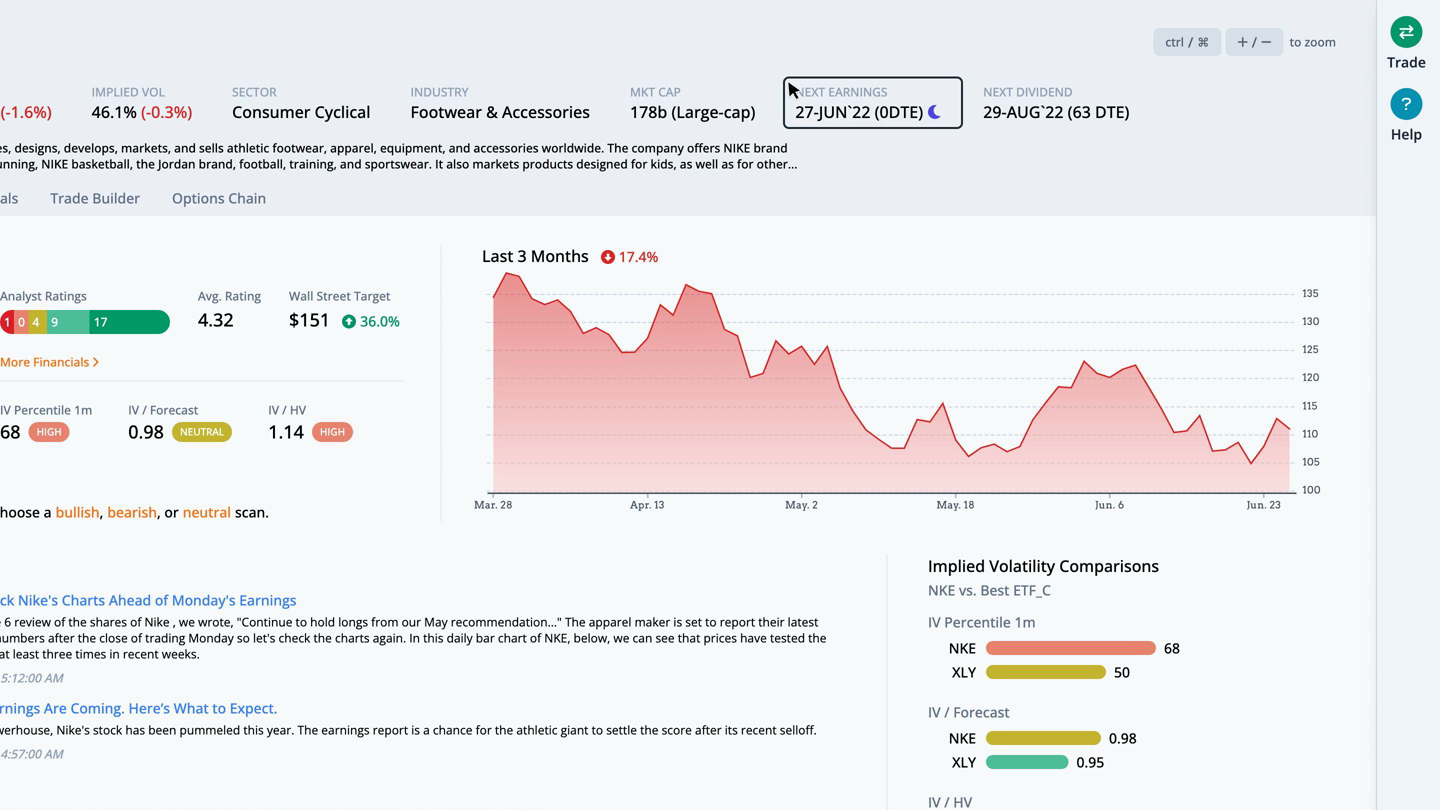
Focusing on Nike, as we click through, we see this large-cap company in the footwear and accessories industry reports earnings on Monday, June 27th, after the close.


tBnL8Vk0Pq4qKPg9Zw-PoK0qSwfCKF_ChyGTKYdHYRXshoXjFg4c_U-oDMTfdSk7oRnl7uGxeWe6EgSTpGZCCRR9FZ9K3Orjz6uOgMu-4pkFmPPwd7GayCJdkQ1PlT5hNTDKnJB14RFpGS0pSA


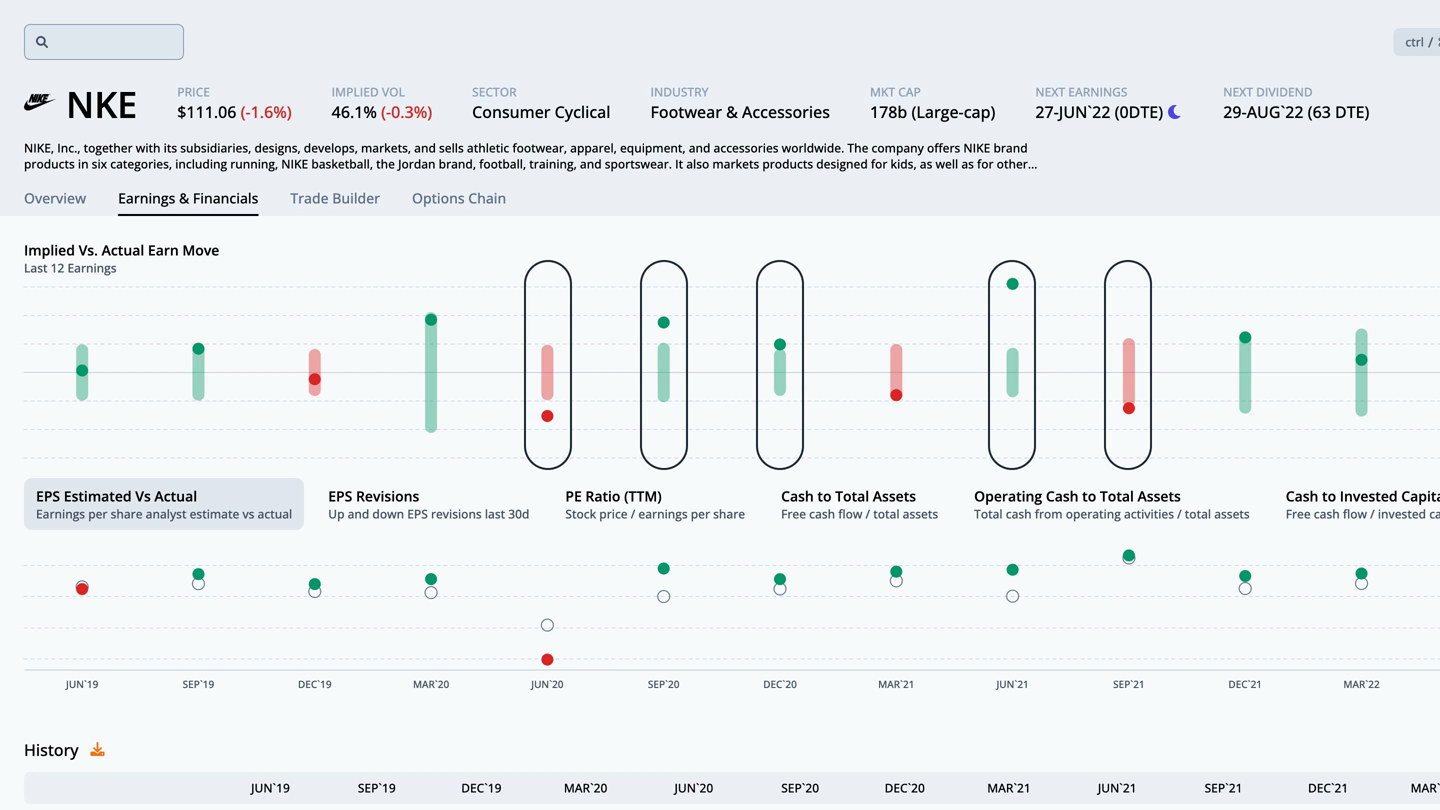
The earnings and financials tab takes us to more detail showing the options market expecting a move of 7.0% in either direction. This move was breached in 4 out of the last 12 earnings.


6GW-1a3-dzF0JDEBmeeWRtpBkqI7Zp-RQozXLxKaWjOvI8IV8sJh9EgSDmJG0XK6m2rGMtpyJwrec5zFEQ-19fAYryknUYRgsg5ePeVX83C9qTyFrk3uPBTLfv5XdC2o-3Vh5t3DSJcDsIZzWw


During that time, the post-earnings move was outside of the implied range 5 times. In those cases, long straddles were profitable. The rest of the earnings moves likely yielded profitable short straddles. We can overlay quarterly financial data by clicking on the ratios below the earn move graph. Let's look at the PE ratio, which is the stock price divided by the trailing twelve months earnings per share.


cuHpoXRh3jtufD5m14afekgcAgsCcS5Tvnpi5dW8FJaTajUXjQEzhs_Brqn_Cukj7Kr5b3ciliN2CNqyU7JbYqcQXGIz_hqPoyDATWs0-bOhyUBPL0zBnslG5igBxMIhU_wyS1ccUG-f-dH5tQ


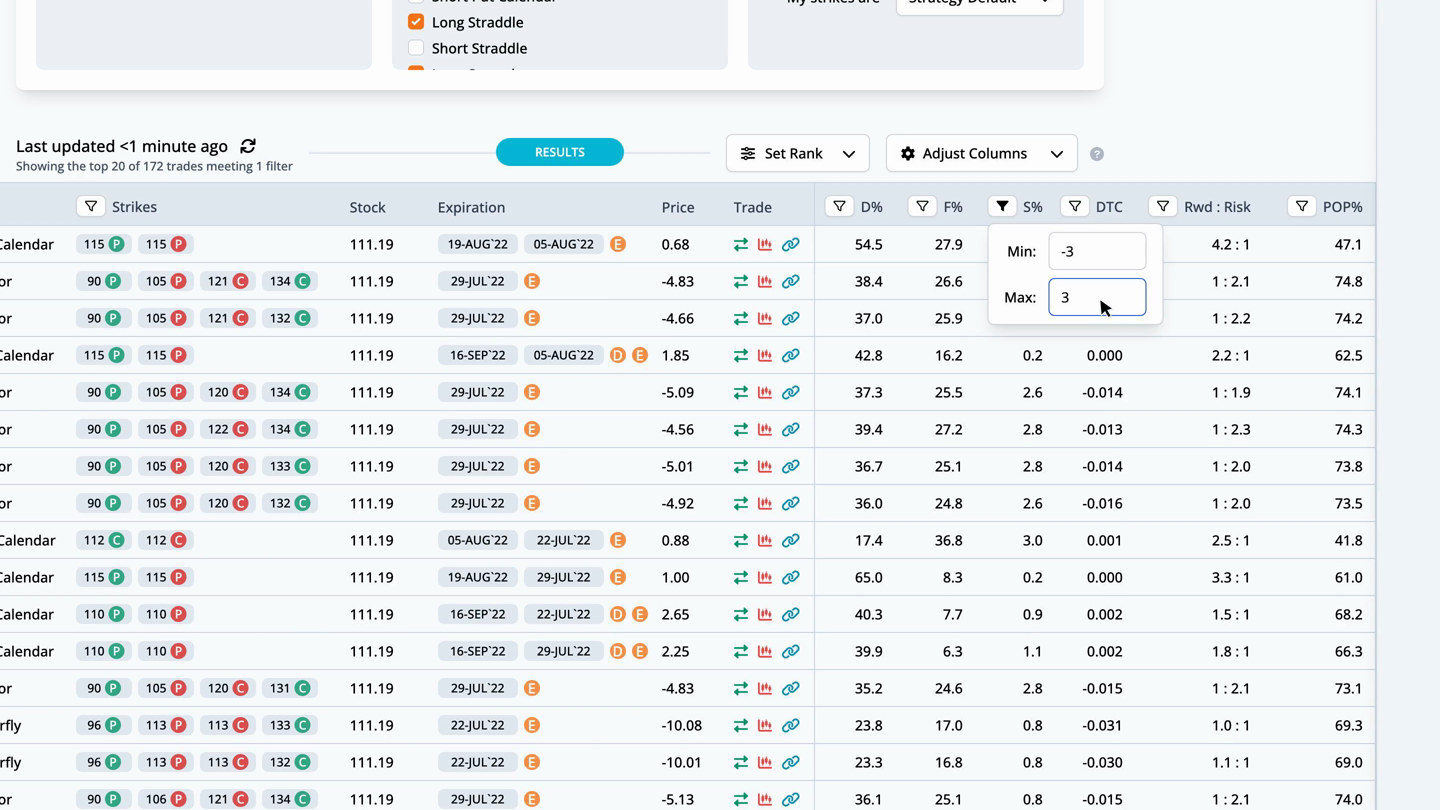
For NKE, the current PE ratio is 29.3, which is 25.8% under the average for the last twelve earnings observations. Returning to the overview tab, we can quickly run a scan to find the best option trades. Since earnings are right around the corner, we scan for neutral strategies, then filter the scan results by S%, or smoothed edge, by setting it between negative and positive 3%.


ftenOVmrhds1Br32lTinzFSCw4Olo_h-TBCMlcXIJq476FShHoWgYFZWJB1tuVzNO8bK_Q7jPgZBxSCq8UBPYsluc0deAIzrEP_8DTKidUkm6MifZPea3fXbNLgKxHftN3t6b4DpX84Fi4hgxg


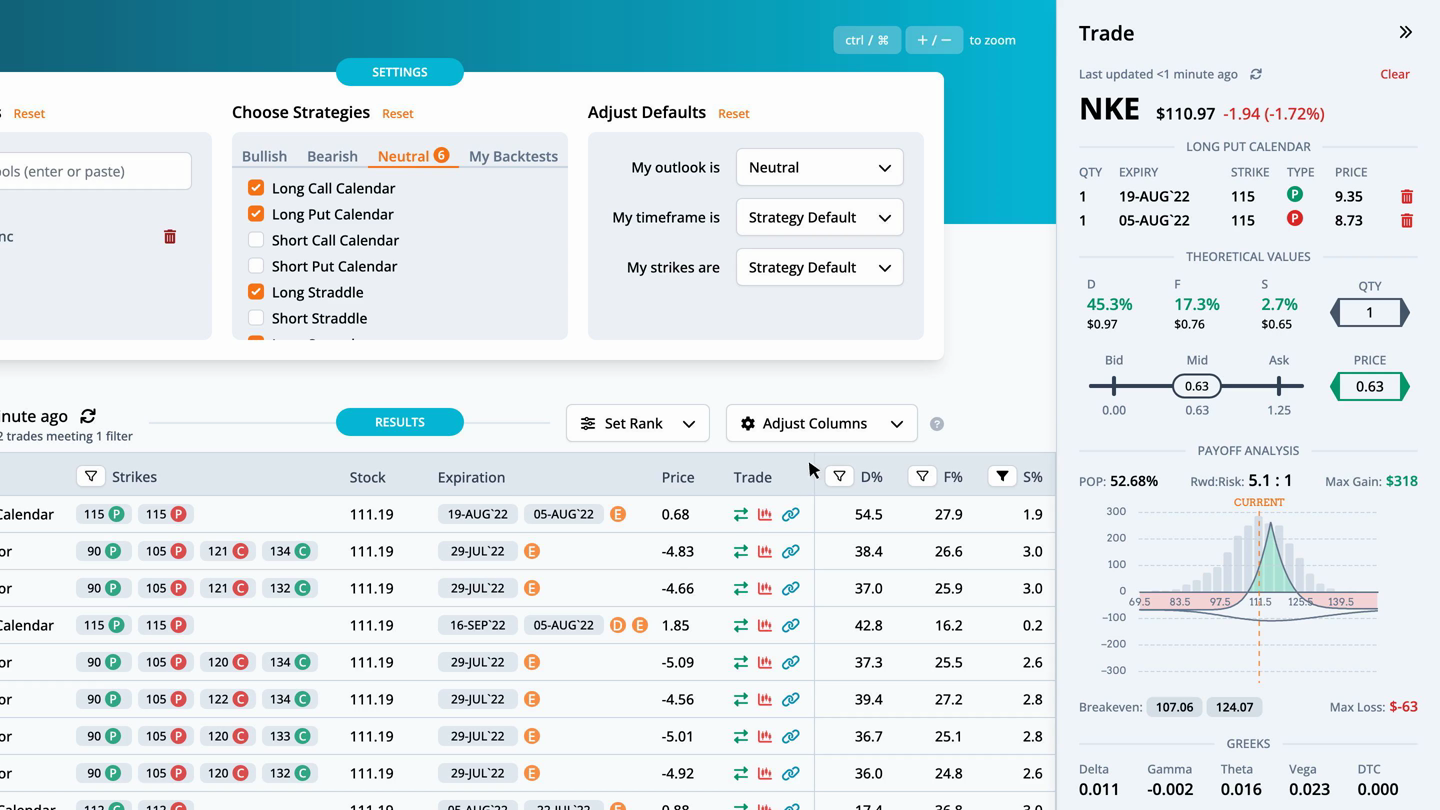
This helps narrow the results to trades that are fairly priced. The highest ranked trade is a Long Put Calendar with strikes at 115, expiring on Friday, August 19th and Friday, August 5th, for a debit of $0.68.


Yc9xZ_ysIOS7yZDxd0RL9vW0L8XeSnMfwTMpBYpJHli9PgfHWNnfmgwy1IXY-BvfnGLjcBxLB3cIc6WEk6MFe1ioIMkiMl2R6pyvnio0ITgRUPn-nmOvicXTYr_MfJTxERfz4HnwNCVkmFDKAw


By pulling up the trade, we can see the theoretical values in more detail. The distribution edge, found by the expected value of the payoff picture on the stock's historical distribution, has an edge of 45.3%. The forecast edge, which is derived from historical volatility, has an edge of 17.3%. Lastly, the smoothed edge, which is calculated by drawing a best fit curve through the monthly implied volatilities, has an edge of 2.7%. The edge is relative to the mid-market price of the trade. Greater positive edges are a theoretical benefit to the trader. We can also look at the payoff graph. The probability of profit sums the probability of the nodes for the part of the payoff picture above the zero profit line over three standard deviations. For this trade the probability of profit is 52.68%. The reward to risk divides the max gain by the max loss. Here the 5.1 to 1 is the ratio of the max gain of $318 to the max loss of $-63. There are two break evens for this Long Put Calendar at 107.06 and 124.07. The total greeks and ThinkOrSwim code complete the information on the trade analysis popout.


fb8mrh35YsrJB_enBHd7DwKKKrFVi2qP0LNXBlbt5YUAu7EelFKQjfyCF22FTB-scTCRERFTUx43H5JvDDXD2FDzmbqMdyDCTzGJKDgU0Jtzz4sO-K_bgVC6qTvFRAYtEhPOwzKFmKsrmmB7sQ


Next, let's look at this trade in the trade builder. Over the last month, the stock price fell 6.3%, while the thirty-day implied volatility rose 13.8%. The average slope of the trendlines is negative. The heatmap on the right side of the graph is green where volatility and slope are undervalued, and red where they are overvalued. In this case, short term IV and slope are neutral, while the long term is slightly overvalued.


uxC_SG_7P_u0taASgEDIq1b10LLTIQNLPqNewRNo0J6Tipu8IJp4jdEioBrrFwGOm4kazw8_CQcUo8OLSzh6pBScfP3EdHeTAnwwqX_C9E62eZG17VZHv9DUeBUN-YRR1mmrtNQZWSZNXRHqKA


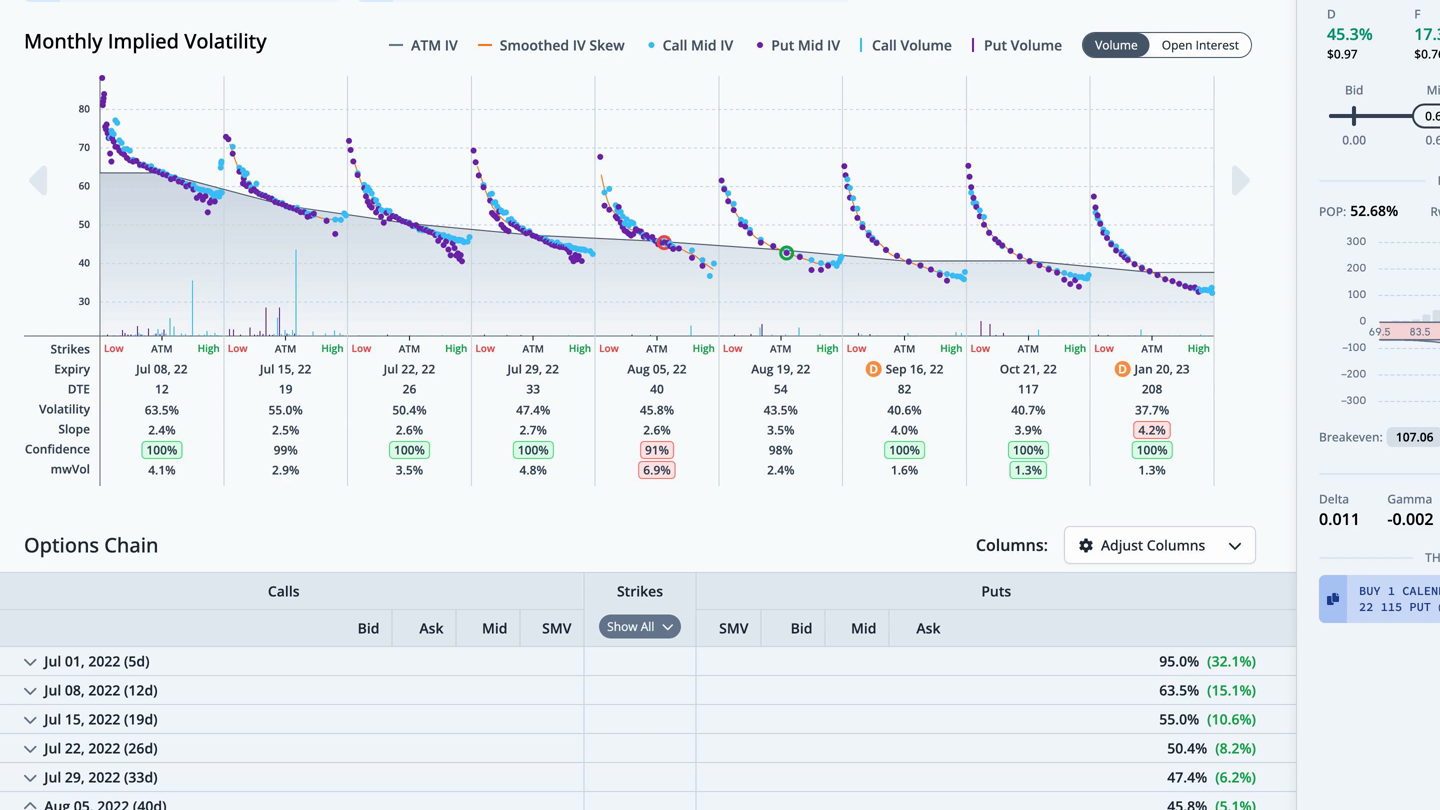
We can also see this trade overlaid on the monthly implied volatility graph in the chain tab. The legs for this trade are circled. For any questions or issues with the article, please contact otto@orats.com. To subscribe to the dashboard, please visit https://orats.com/dashboard
 
Walgreens Boots Alliance (WBA) Earnings Report

Welcome to the ORATS earnings report where we scan for companies with upcoming earnings announcements, check out historical earnings information, and find a potential options trade.


Read on or watch the video overview here:
.


Let's start by running a scan on stocks reporting earnings this week, which includes the total option volume indicator, sorted from greatest to least.


VDs4KUKlmjx1tJ3jo4OWBVCz9VTkVCDP_9J-RyrOIlOHDLYWzSpo9PuIr_PlIIipD9QdfdMmxcWB6WtUFOKtjXzIemYSDlIxZ6PHAXAr1EYfrH8lywi89k_jo4u5XiTNR8GxaDbJl6IuykS82jw


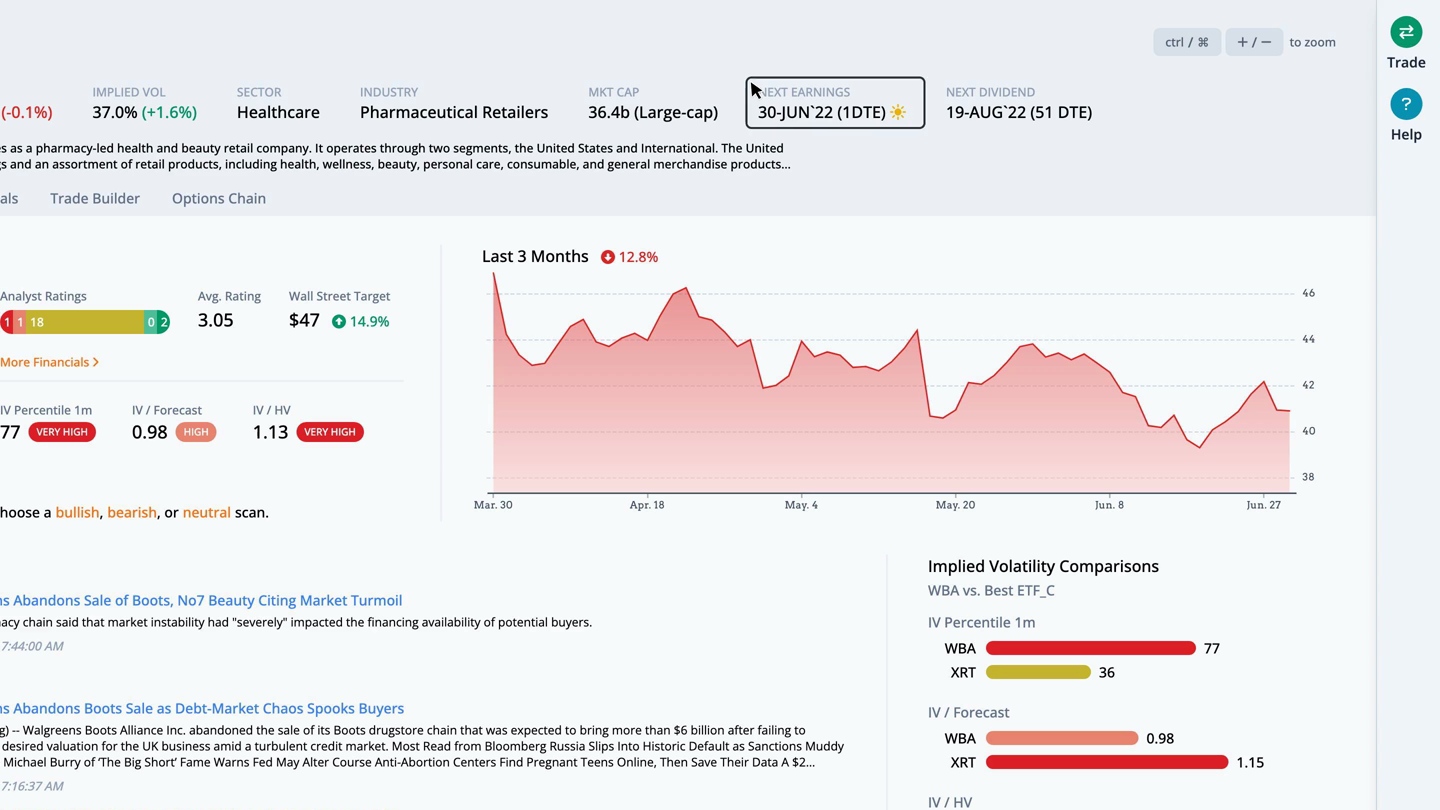
Focusing on Walgreens Boots Alliance, as we click through, we see this large-cap company in the pharmaceutical retailers industry reports earnings on Thursday, June 30th, before the open.


4rdnVS3hf3A0Sv8CtoAUbWkOSaaTRKuWsrATGB2ox8FFGObGktm9xUiZXCl_Q1H8GyPLC-Dd4Ts2sFm_OU1_Rwt1URd9m88GOPZVO3aoYZsM6facPm_DrXjPMEpJ3ihDpQVYd88iBp_ePx2pEIk


The earnings and financials tab takes us to more detail showing the options market expecting a move of 5.0% in either direction. This move was breached in 6 out of the last 12 earnings.


ZP4nrEIQ-ZlNb_ZHHeIMJTir3yKfnARoy3EW7UKDBnbE0osQXyx-EyBJA-OoofVxyHAaSebzCzMHtKZpGpl3wgXTkz5ZAlKyPoTZmnlQ2MEVctEOJQm-0vtWPHBiL4dXpz0gnAkKbhF8nth2KkY


During that time, the post-earnings move was outside of the implied range 5 times. In those cases, long straddles were profitable. The rest of the earnings moves likely yielded profitable short straddles. We can overlay quarterly financial data by clicking on the ratios below the earn move graph. Let's look at the PE ratio, which is the stock price divided by the trailing twelve months earnings per share.


spFgT52wLPR-otHKWSU2N92u5wolE55wavCSa585F3NBO73LRPJYV0Nx9_yFatH980fp1Y2s88PdhoOsWXUmQ3Kz8vp_DMPpusdfTUgNXBKQxoXSDMUfMbXwObcH2utPoBsISk_2lLvrOrrfNHA


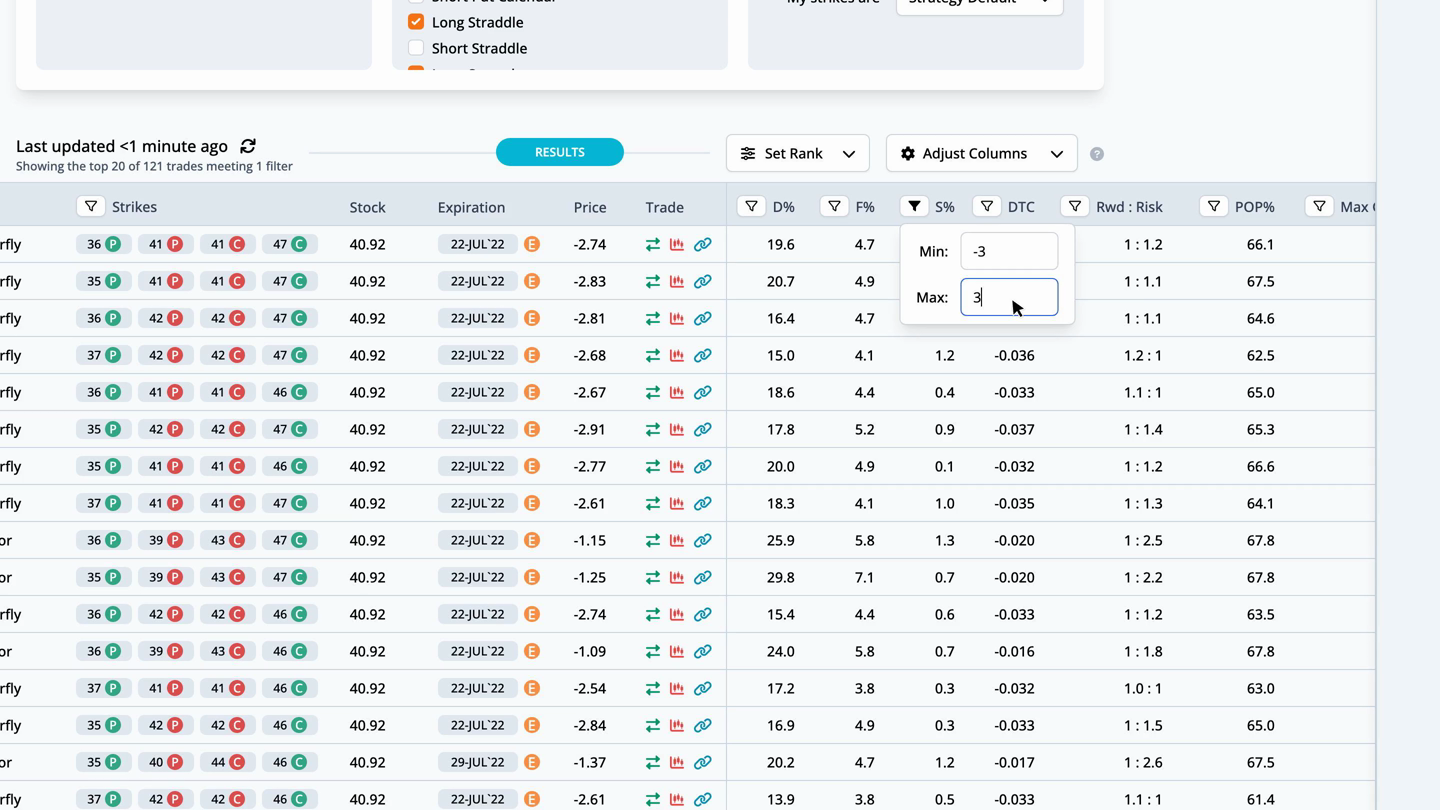
For WBA, the current PE ratio is 7.0, which is 1.3% over the average for the last twelve earnings observations. Returning to the overview tab, we can quickly run a scan to find the best option trades. Since earnings are right around the corner, we scan for neutral strategies, then filter the scan results by S%, or smoothed edge, by setting it between negative and positive 3%.


ICZDhJR-Jgsna2w-S9WT5YFayiPLMq4qiX4cbg91RrDHuENEjwo43D1PqJ8_LJYT3XTNJ7nZ2khZUrS29zYArF1T_CCM76_Qhlojt5fY9n_49psdnCZcFCzHFJ0hlq3eb2GWEUKk1Caqf04Dg7k


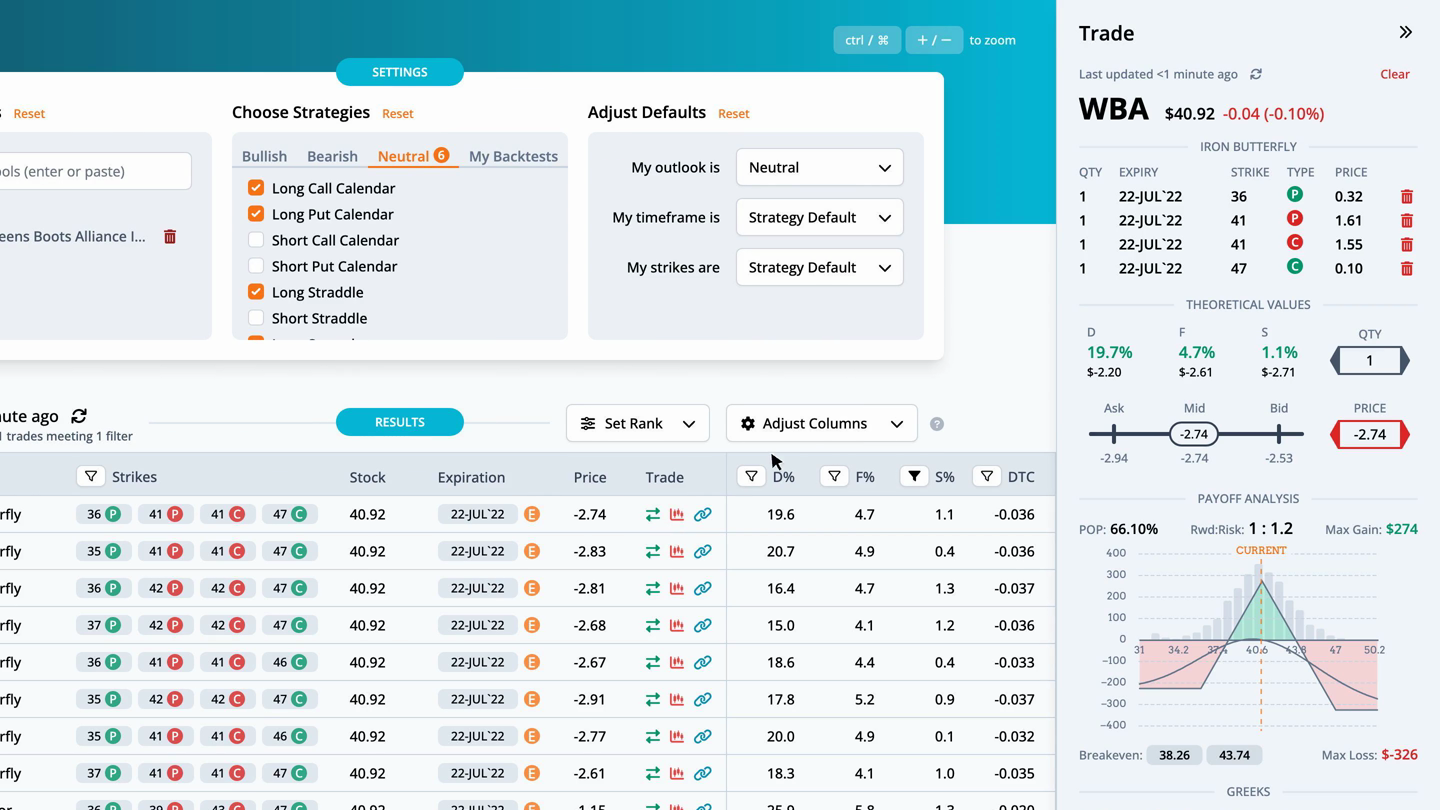
This helps narrow the results to trades that are fairly priced. The highest ranked trade is a Iron Butterfly with strikes at 36, 41, and 47, expiring on 2022-07-22, for a credit of $2.74.


-GCBgNFSNHXdPoOJb8CDAGTUZnYZ9RDKkJ6hyv8h2NYzMYruhzH6zAApg6UroimxhhHIetUTH2LhWFoCLkPO6js6dKjFXmVwSgKrlOm5qlmEbk9H8aSihK3gFrDcqL0VdlvIDnhstAv6a3Z_g-g


By pulling up the trade, we can see the theoretical values in more detail. The distribution edge, found by the expected value of the payoff picture on the stock's historical distribution, has an edge of 19.7%. The forecast edge, which is derived from historical volatility, has an edge of 4.7%. Lastly, the smoothed edge, which is calculated by drawing a best fit curve through the monthly implied volatilities, has an edge of 1.1%. The edge is relative to the mid-market price of the trade. Greater positive edges are a theoretical benefit to the trader. We can also look at the payoff graph. The probability of profit sums the probability of the nodes for the part of the payoff picture above the zero profit line over three standard deviations. For this trade the probability of profit is 66.10%. The reward to risk divides the max gain by the max loss. Here the 1 to 1.2 is the ratio of the max gain of $274 to the max loss of $-326. There are two break evens for this Iron Butterfly at 38.26 and 43.74. The total greeks and ThinkOrSwim code complete the information on the trade analysis popout.


EgQ7qbWrKkMbbnHshP4QxbcuRhUUnQ4ZLBTRVO-LDrpHi_Eh7-zgwUj4esl2ToWfD_F7-gNAbxfKbX2qXtE-CnTVIIDSV31cq3Rk4m_XvblFEkfurXwlTTbNs9uNkbDozYIt_u6rUqe8bYOYCXU


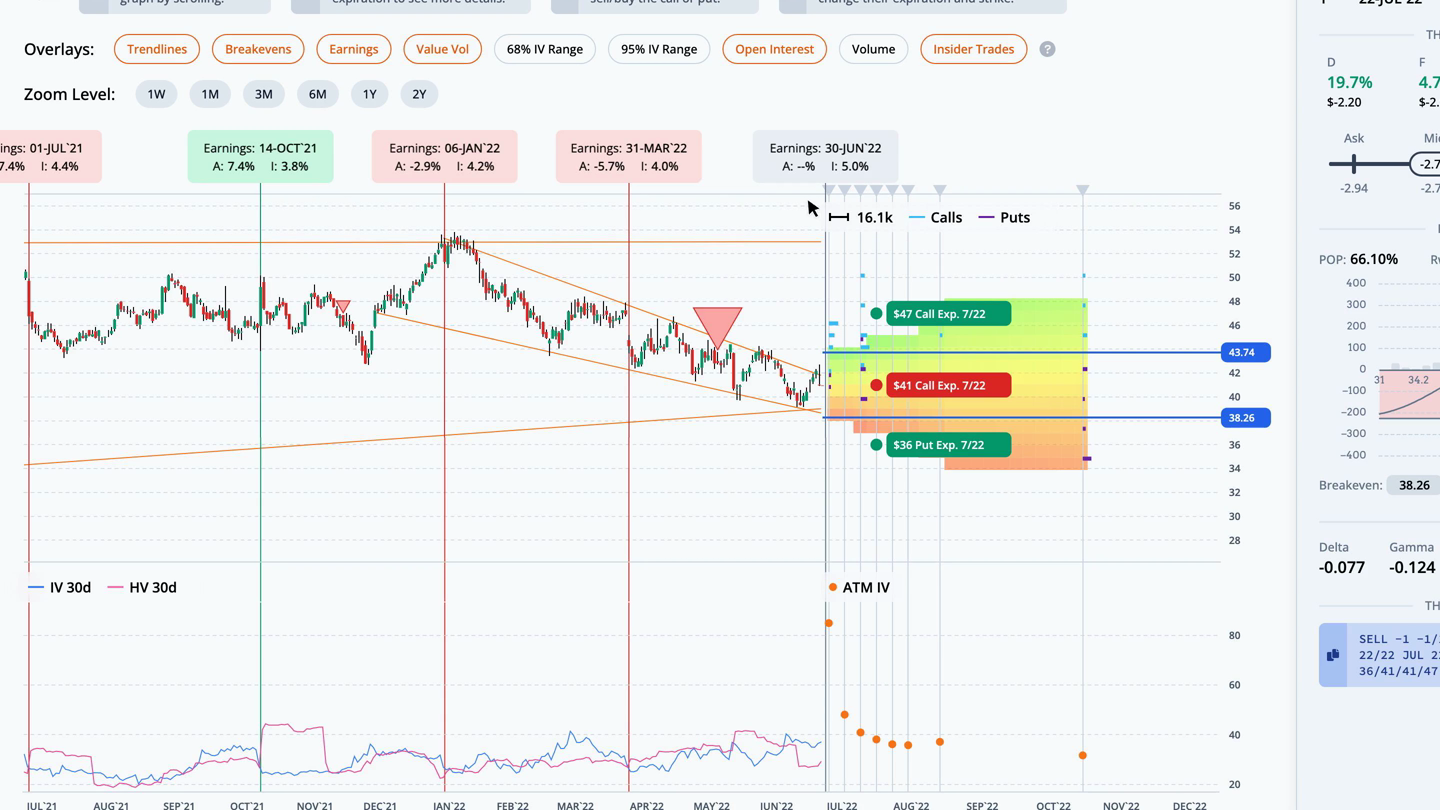
Next, let's look at this trade in the trade builder. Over the last month, the stock price fell 6.6%, while the thirty-day implied volatility rose 31.0%. The average slope of the trendlines is negative. The heatmap on the right side of the graph is green where volatility and slope are undervalued, and red where they are overvalued. In this case, short term IV and slope are slightly overvalued, while the long term is slightly overvalued.


POsDFTh-EzVLuIFfrzB84jmR44_hl36zbpFwv8gsBvIh35tE8YRqjzoLpcso3Act319KdiXxbn10U9-c4PsHO2Mw88QOHH6opj-R5UgfTyvN0dBn-j9wvmrRHDXfJBI7Q0k2vXYcd3y1tPrhRdM


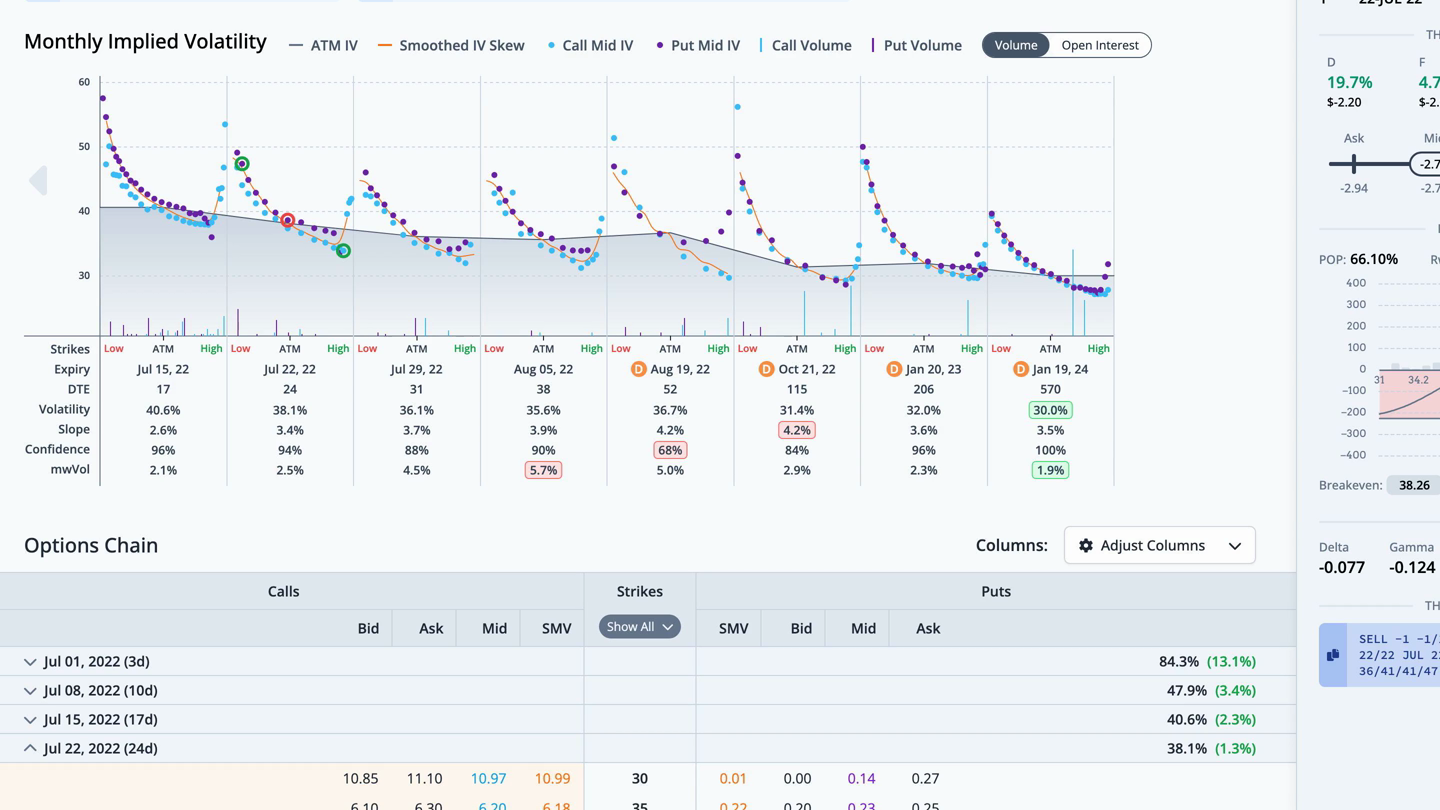
We can also see this trade overlaid on the monthly implied volatility graph in the chain tab. The legs for this trade are circled. For any questions or issues with the article, please contact otto@orats.com. To subscribe to the dashboard, please visit https://orats.com/dashboard
 
Micron Technology (MU) Earnings Report

Welcome to the ORATS earnings report where we scan for companies with upcoming earnings announcements, check out historical earnings information, and find a potential options trade.


Read on or watch the video overview here:
.


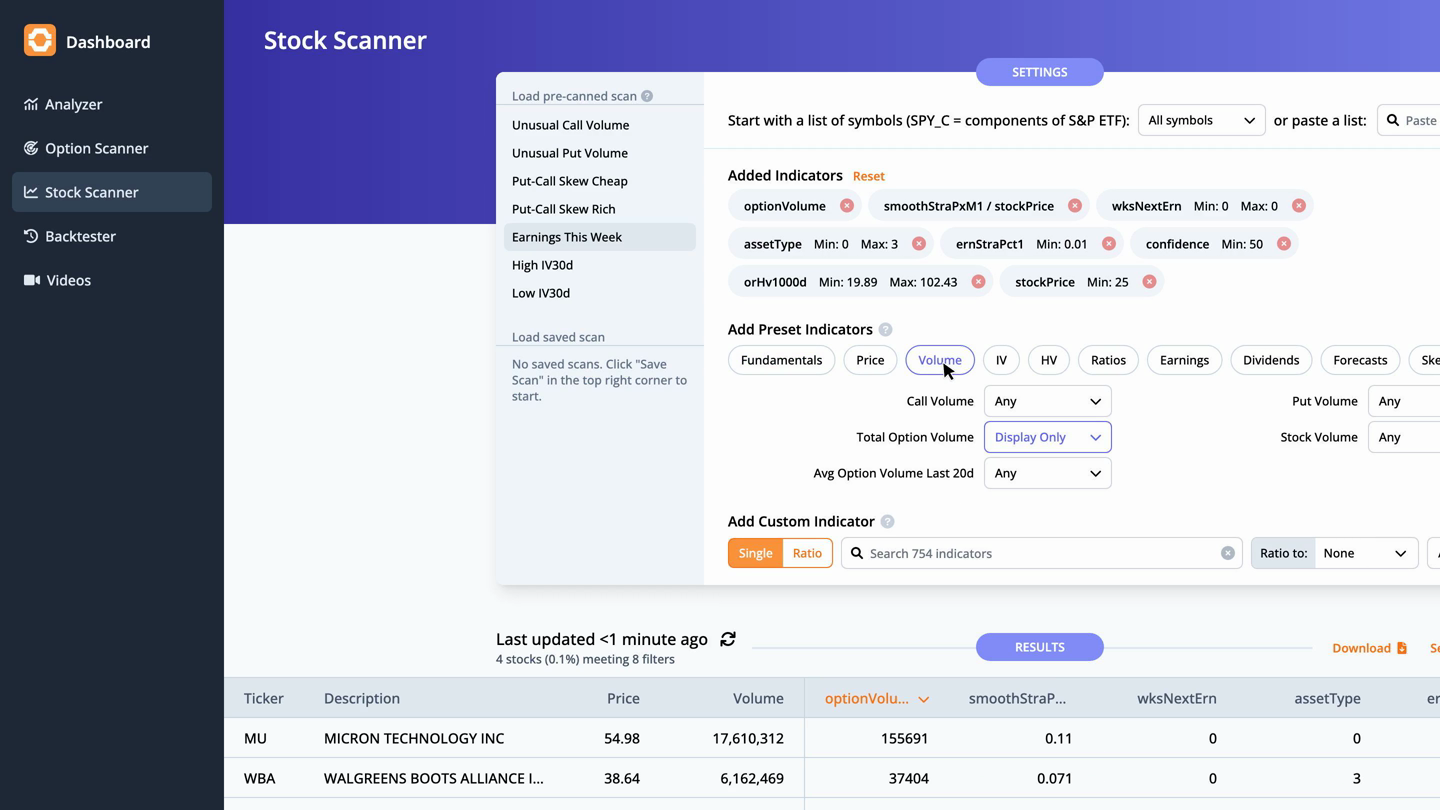
Let's start by running a scan on stocks reporting earnings this week, which includes the total option volume indicator, sorted from greatest to least.


0bmZxStjfDUkJtrpry-JmrpYu_MwV55Nm46xjbTKt_3w5xdePnNsWLKIn6tXpJcUwECU3E0pTwwugBMBrqdKjGMmumtthpKtHV18kpvP9F0VBSbG0szGyc4Q11SzxgyYTBetAPn0AOlPt8zRSC4


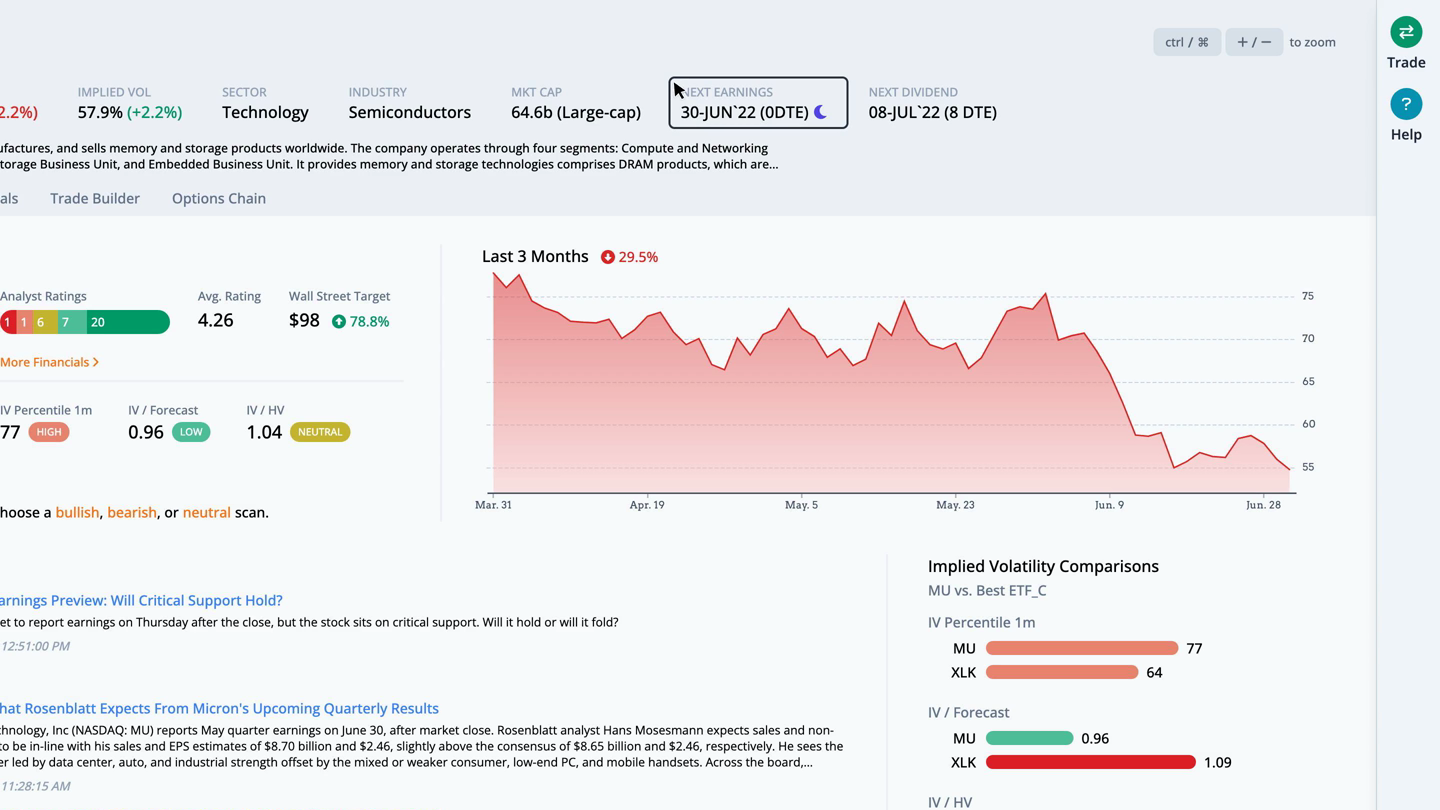
Focusing on Micron Technology, as we click through, we see this large-cap company in the semiconductors industry reports earnings on Thursday, June 30th, after the close.


WbEt6k5csvEKgAvhsdXuhZLnsYDChb57XNnc1SIYb37OSVou8aAnDbscwL26inzltemNDvlnfTKGxRf_Dy9c-6fG6xevXsew5RL5dm543WCC3q2bWPjiEhBW1u2eSZBkQOvZr2pFDPI1ekbXdVI


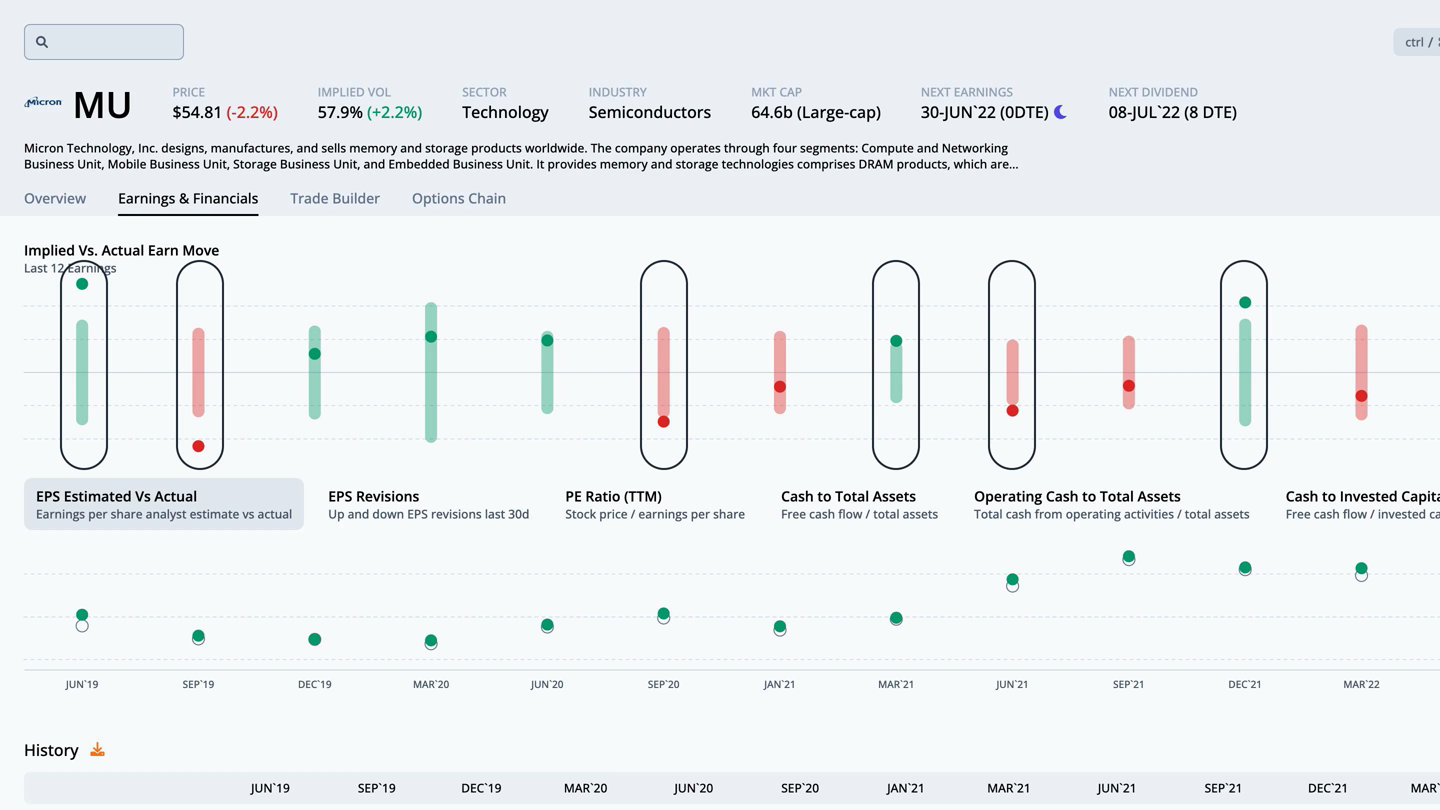
The earnings and financials tab takes us to more detail showing the options market expecting a move of 7.3% in either direction. This move was breached in 4 out of the last 12 earnings.


0Cmn8kv288pN3mIs4pr6XXy4awBR-Uz_icJraNiR0CFN9OuDvvyyVEgUb7qqSf1_Xmwferr-3M7GllVSSkHqd2ztV1bhhyEP-5DkRbTz66IIINt0RPiSk5eePWKgZ00OhjErmubkSfjYeGYb_Cc


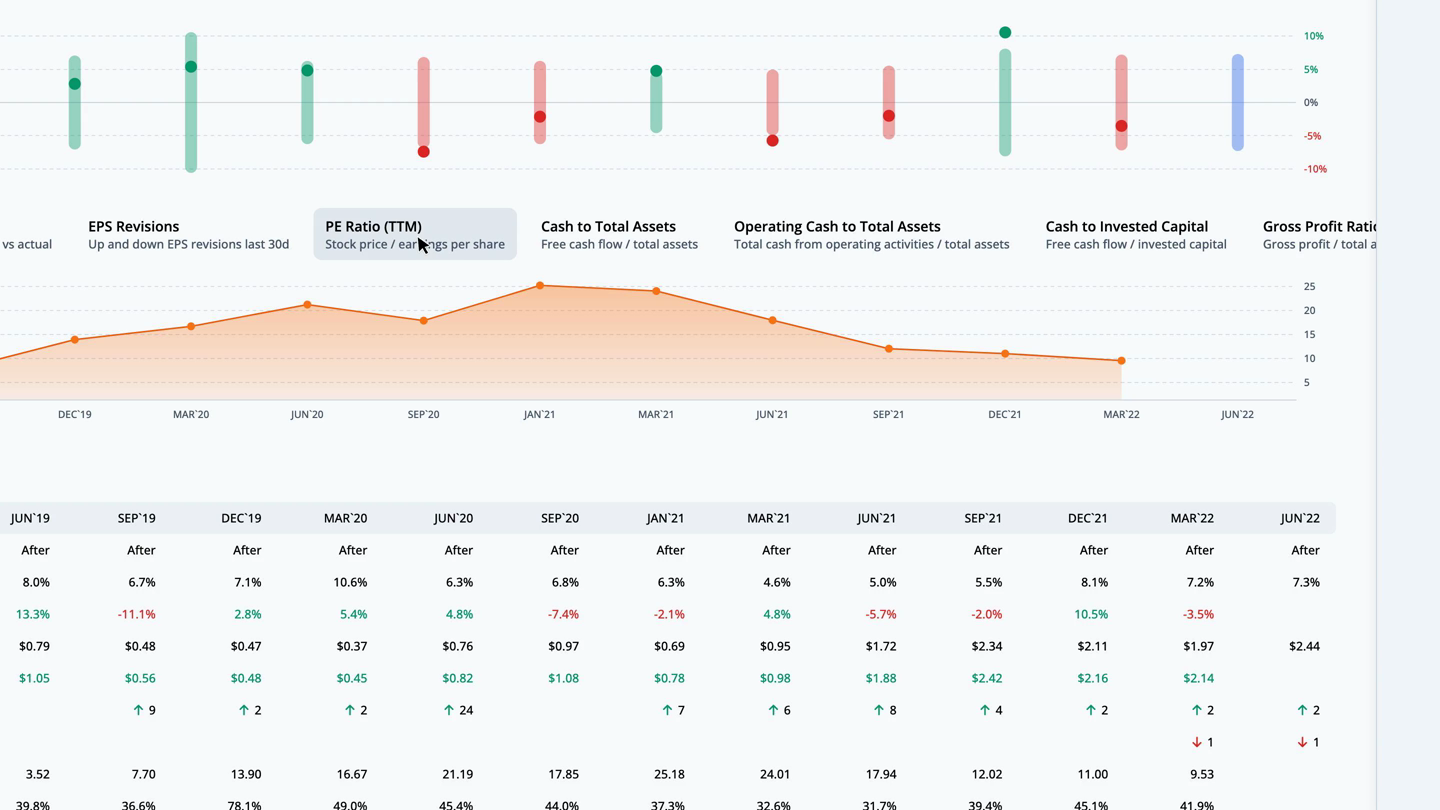
During that time, the post-earnings move was outside of the implied range 6 times. In those cases, long straddles were profitable. The rest of the earnings moves likely yielded profitable short straddles. We can overlay quarterly financial data by clicking on the ratios below the earn move graph. Let's look at the PE ratio, which is the stock price divided by the trailing twelve months earnings per share.


KnBCUeS62EckZTVlQogBDvgRJumMBqL9cg6mRMCCAMD0Owc4d_-NtKsDNX3phaQcExbCKt-_SMM9t_adI-_Eqbq48_UUSY21D28JyqoIHQhiI1Ji3Q1RmGLd92AXA6Ef0al49YxEYHQKsbXVP9c


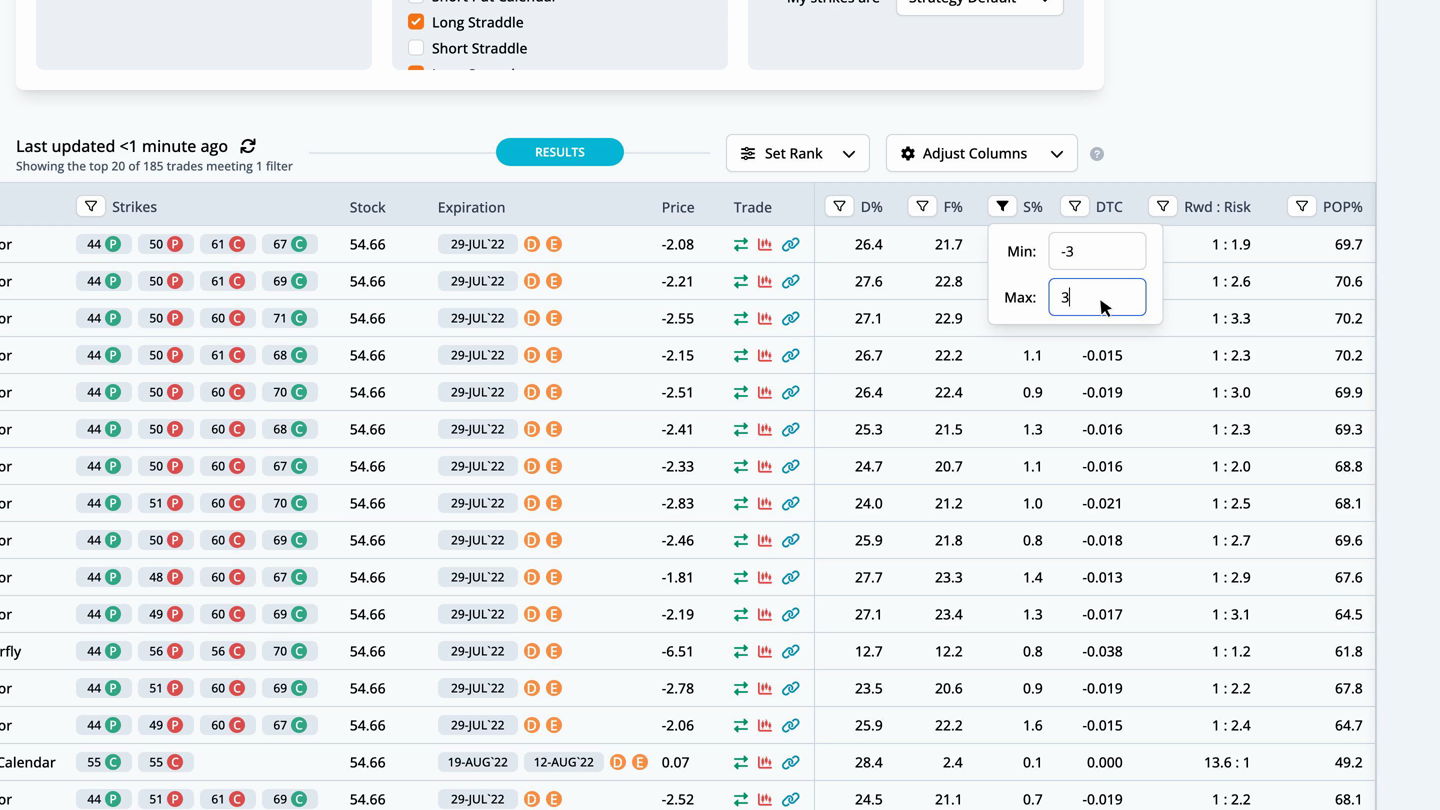
For MU, the current PE ratio is 6.4, which is 50.5% under the average for the last twelve earnings observations. Returning to the overview tab, we can quickly run a scan to find the best option trades. Since earnings are right around the corner, we scan for neutral strategies, then filter the scan results by S%, or smoothed edge, by setting it between negative and positive 3%.


LkM7uN4MmQHfiBZELkpmahjJLzuenlhVrn2GqvgIlo7AHDLaqvb3f-Yhe6bI_EtajU0Ve24IpvdtPDItpqYzU3RUlBw5dNAUgHuHkcV30rOYD_DTbb0xtv-7dWhKWimcLEK0jeqlP8X7RH2CfZc


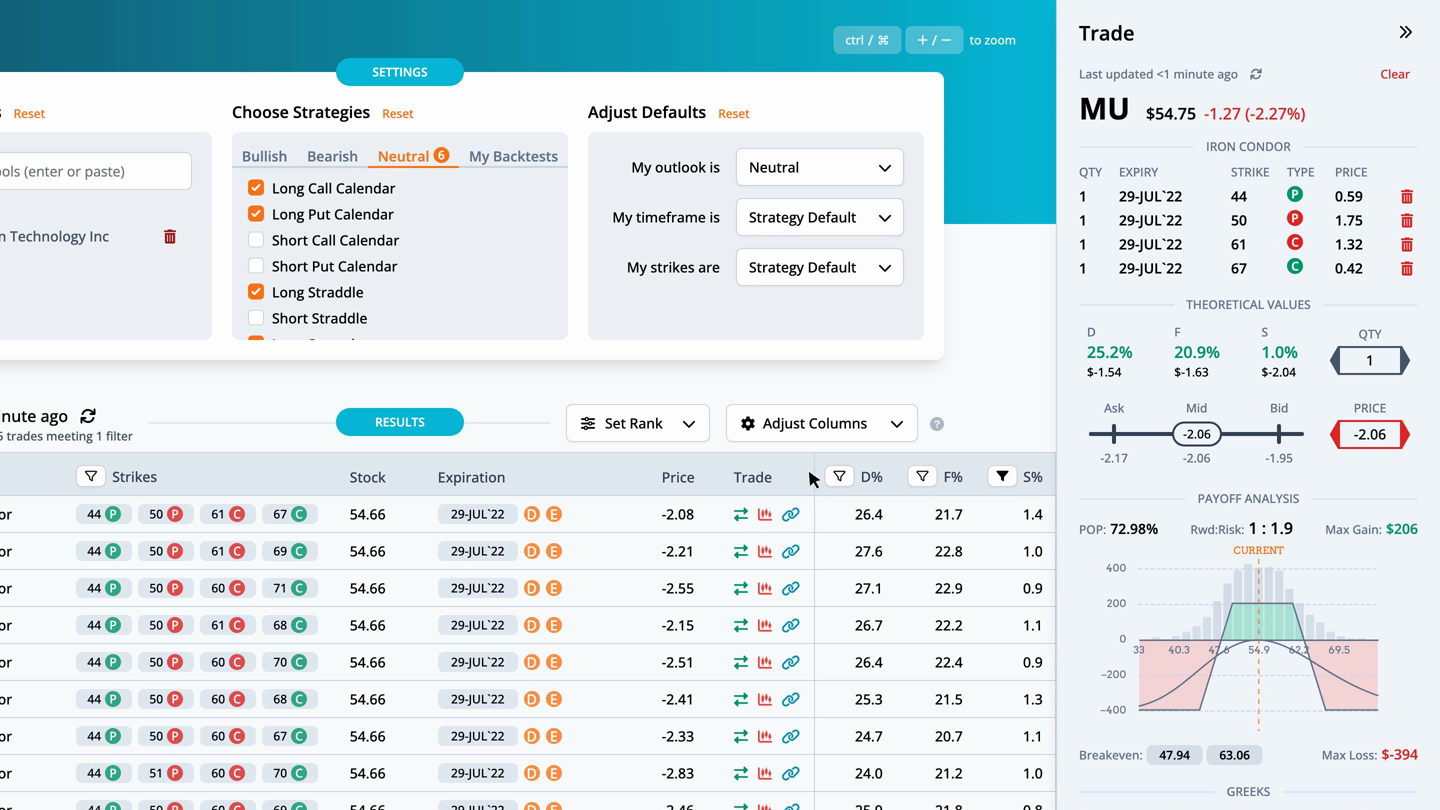
This helps narrow the results to trades that are fairly priced. The highest ranked trade is a Iron Condor with strikes at 44, 50, 61, and 67, expiring on 2022-07-29, for a credit of $2.08.


jZ0-5qOhkCk3IdKhZpfUGXkw0jbDZw8z0_buJn143VbjEkGwhZtkTcPpuPP1PRRZ_FqMHd7Gj3N7jcNvEhren0rn_7hA9uxjhc0oL_cXlaqoqQ0hnBwi_hMqnL_LjL5q5OF_dMFV-rx4rtha4f8


By pulling up the trade, we can see the theoretical values in more detail. The distribution edge, found by the expected value of the payoff picture on the stock's historical distribution, has an edge of 25.2%. The forecast edge, which is derived from historical volatility, has an edge of 20.9%. Lastly, the smoothed edge, which is calculated by drawing a best fit curve through the monthly implied volatilities, has an edge of 1.0%. The edge is relative to the mid-market price of the trade. Greater positive edges are a theoretical benefit to the trader. We can also look at the payoff graph. The probability of profit sums the probability of the nodes for the part of the payoff picture above the zero profit line over three standard deviations. For this trade the probability of profit is 72.98%. The reward to risk divides the max gain by the max loss. Here the 1 to 1.9 is the ratio of the max gain of $206 to the max loss of $-394. There are two break evens for this Iron Condor at 47.94 and 63.06. The total greeks and ThinkOrSwim code complete the information on the trade analysis popout.


2SaowsUdkR7chzn_fMmOI_BRK36zpaEvz3qzW2fBoHgQANpLswdpiD1T3rgnQaXjgE5Hxg9ww7i9RpnF7QibOaiHbtR1Y7YkWOb6DNjrx7vmO2BRMKDKWQevV6hJxzjx6TutEw8zNLJZgk-dD6k


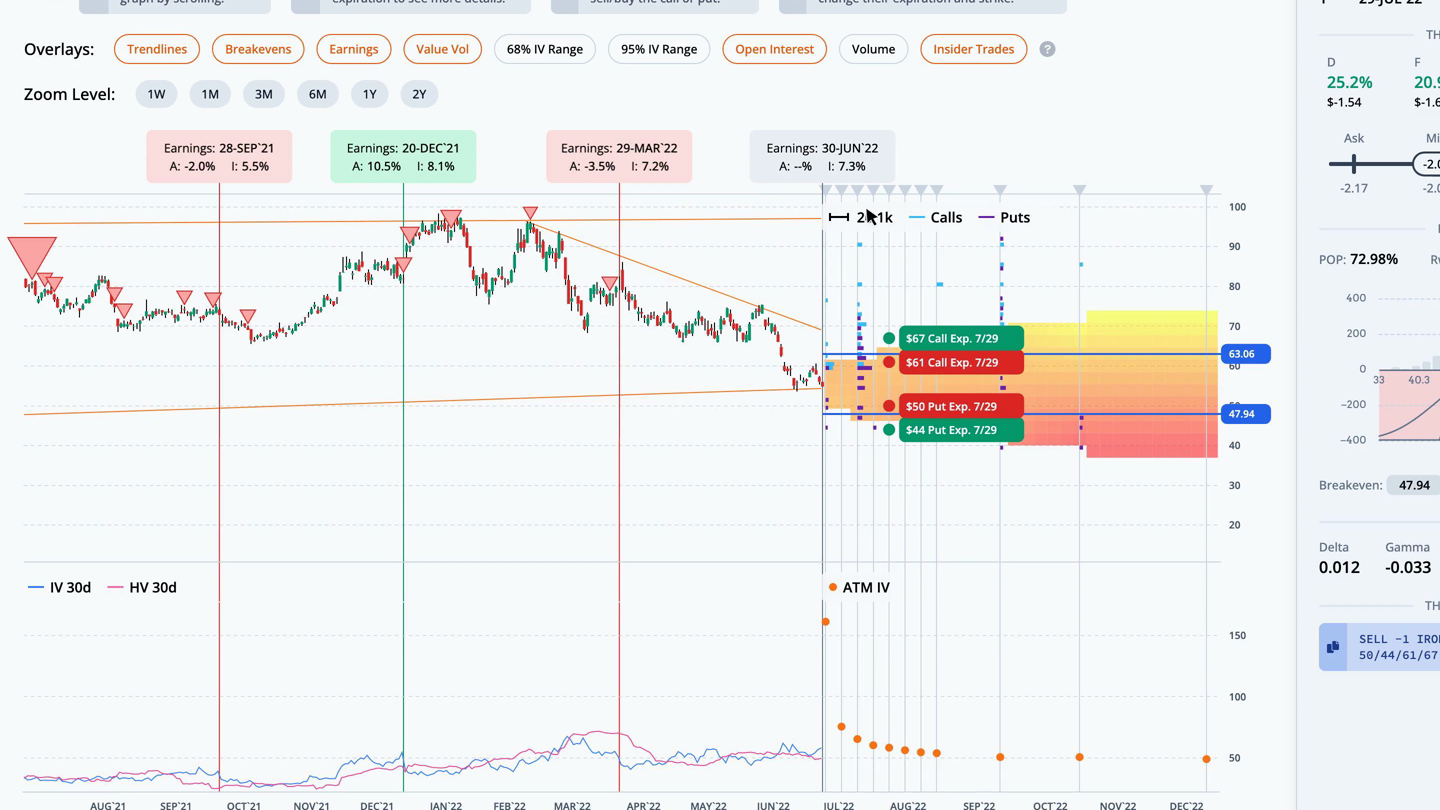
Next, let's look at this trade in the trade builder. Over the last month, the stock price fell 25.8%, while the thirty-day implied volatility rose 22.9%. The average slope of the trendlines is negative. The heatmap on the right side of the graph is green where volatility and slope are undervalued, and red where they are overvalued. In this case, short term IV and slope are neutral, while the long term is overvalued.


DrpJtTX7Jka25KvNwCOW_elJgnko_S7HibRMP9n8KFuEOVgJSx2BSzno-A3oUaZpA48EvRNaAe7pl-CyFOq64axPpgSoqmYgDa0QAlkPG90ADhiwziY-cR8iTlJvjWqEodRgsoY1EntgViBS13w


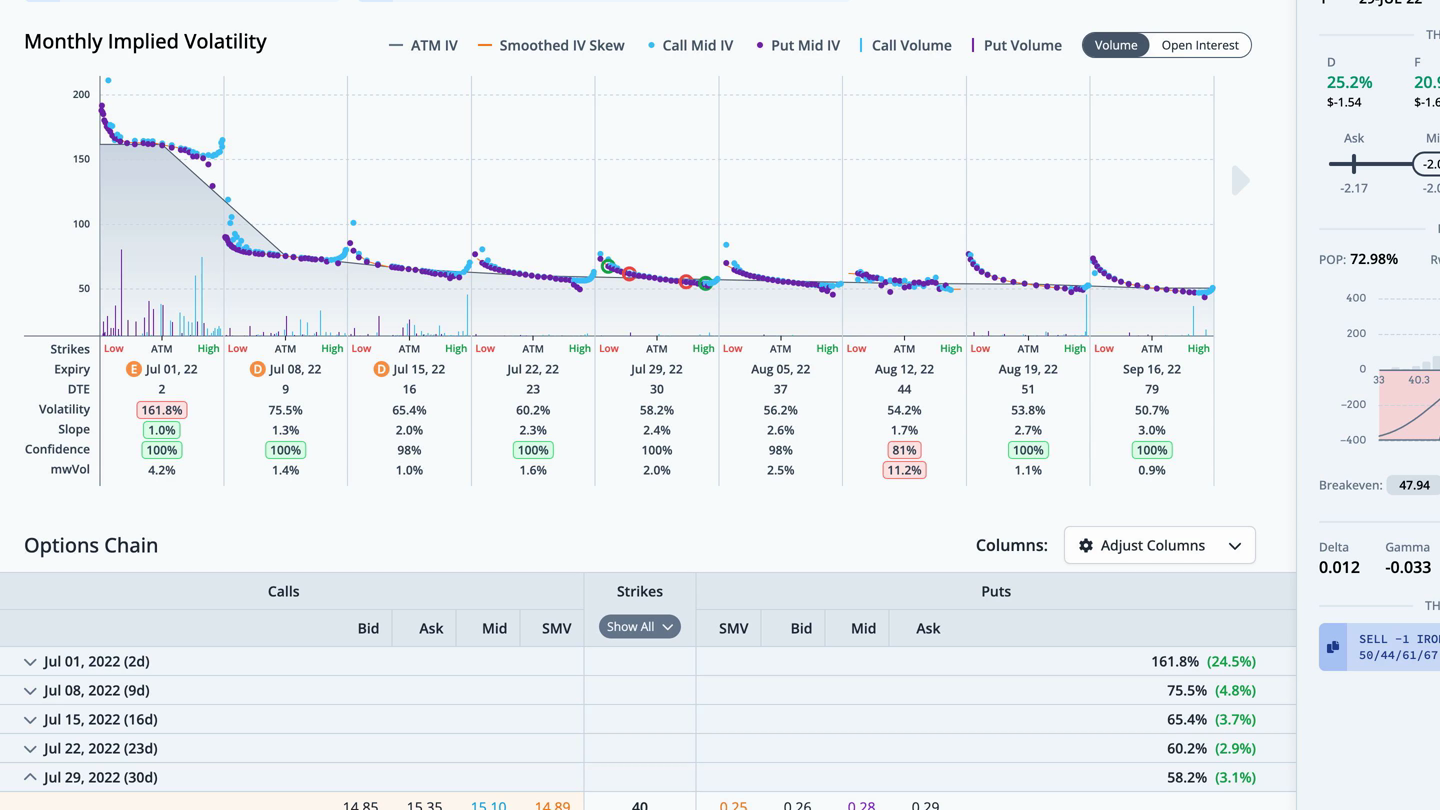
We can also see this trade overlaid on the monthly implied volatility graph in the chain tab. The legs for this trade are circled. For any questions or issues with the article, please contact otto@orats.com. To subscribe to the dashboard, please visit https://orats.com/dashboard
 
PepsiCo (PEP) Earnings Report

Welcome to the ORATS earnings report where we scan for companies with upcoming earnings announcements, check out historical earnings information, and find a potential options trade.


Read on or watch the video overview here:
.


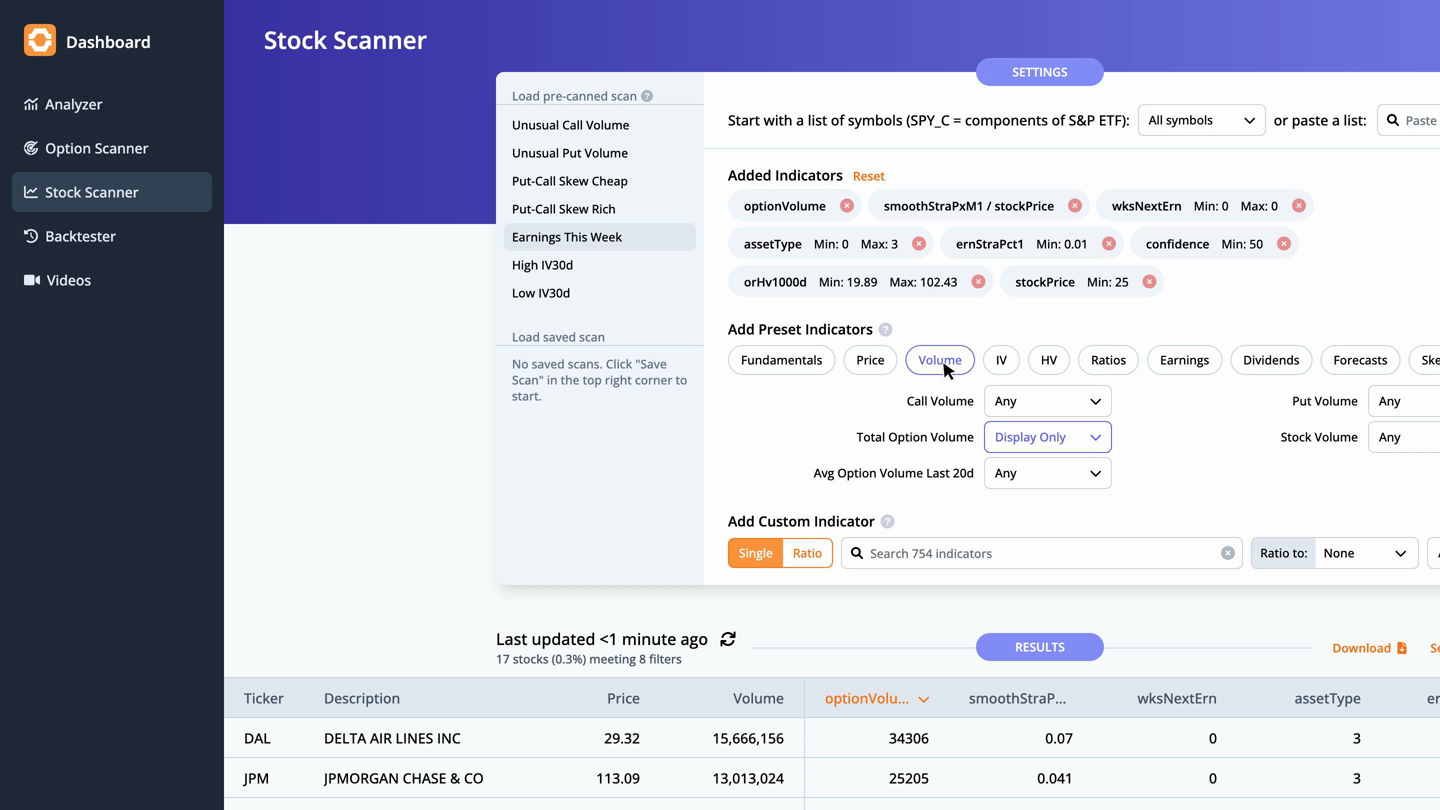
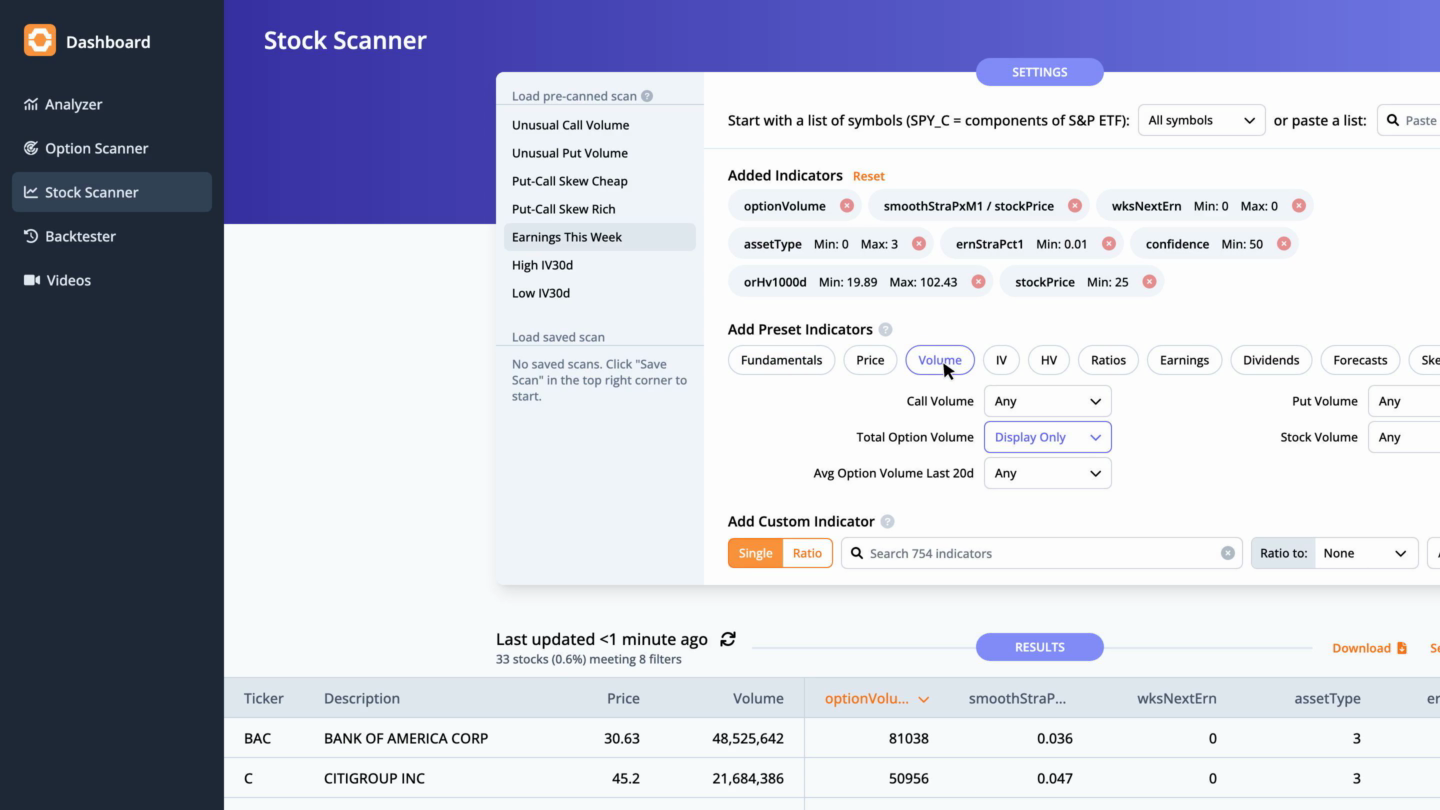
Let's start by running a scan on stocks reporting earnings this week, which includes the total option volume indicator, sorted from greatest to least.


x2Yf0x6ubhYHMCCsA7BWSUGqFTq-ZaldTX_JRzP31GknlisxGfWnCfuhGB3_6G74-3g6ljJNShDs8Kcj91ki8Q5kExaxAZjLgAXE6MULvxP_TJ5L_qHZ5xNb0fHOQxQ777VMCux2u0dx4QCZ5_0


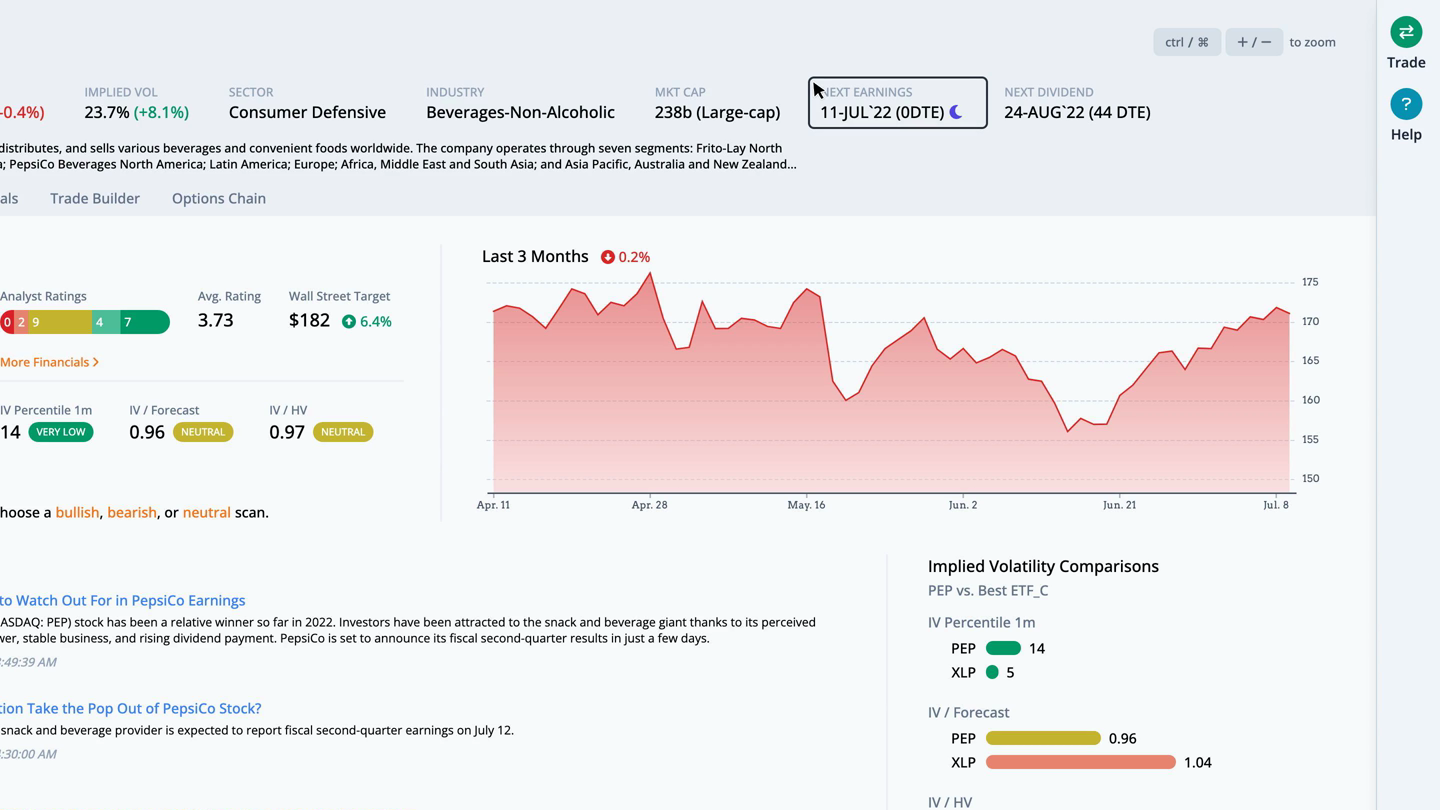
Focusing on PepsiCo, as we click through, we see this large-cap company in the beverages-non-alcoholic industry reports earnings on Monday, July 11th, after the close.


jpdSbW-ziYjIl7B4usppeBp0LWOrXaXRPIJE8lsfzS4UtLESqn1Bc6-W5bCvrevzuw4-z7MO6H2-hN82L3wFoQMbjJSr80xHB8Uu6IuMphv1EKbWYdZg6_NlXPhkIe0qJP3eOebQffK_l4QjgjQ


The earnings and financials tab takes us to more detail showing the options market expecting a move of 2.6% in either direction. This move was breached in 0 out of the last 12 earnings.


vjaghJdMJ9MtduXyAkojlon6r2GNohp3XTzc2YrFQ-J_k2Aw8lDWR3aSl1vJ2TgUZsPNy3BcIAQCJm6GZOsskWSE_W52anigBVoa4KeAnJr19lPL9a7xrh59snZIGQSDLoVgiglJHXhRVRr4wig


During that time, the post-earnings move was outside of the implied range 1 times. In those cases, long straddles were profitable. The rest of the earnings moves likely yielded profitable short straddles. We can overlay quarterly financial data by clicking on the ratios below the earn move graph. Let's look at the PE ratio, which is the stock price divided by the trailing twelve months earnings per share.


NyYwuxOXbSpIP4NqO3HnFV6uMoPTR0ms6dZPGcY_9_-JqEbUPxwY07TgY79EUsW-zH8v77dJmqd32Z0eDTEpL98imTYIM0M19nPfMUFGWXyi20cwKEPuZq39g5y8Frc1QfcsscRTxtEqYFV7-VI


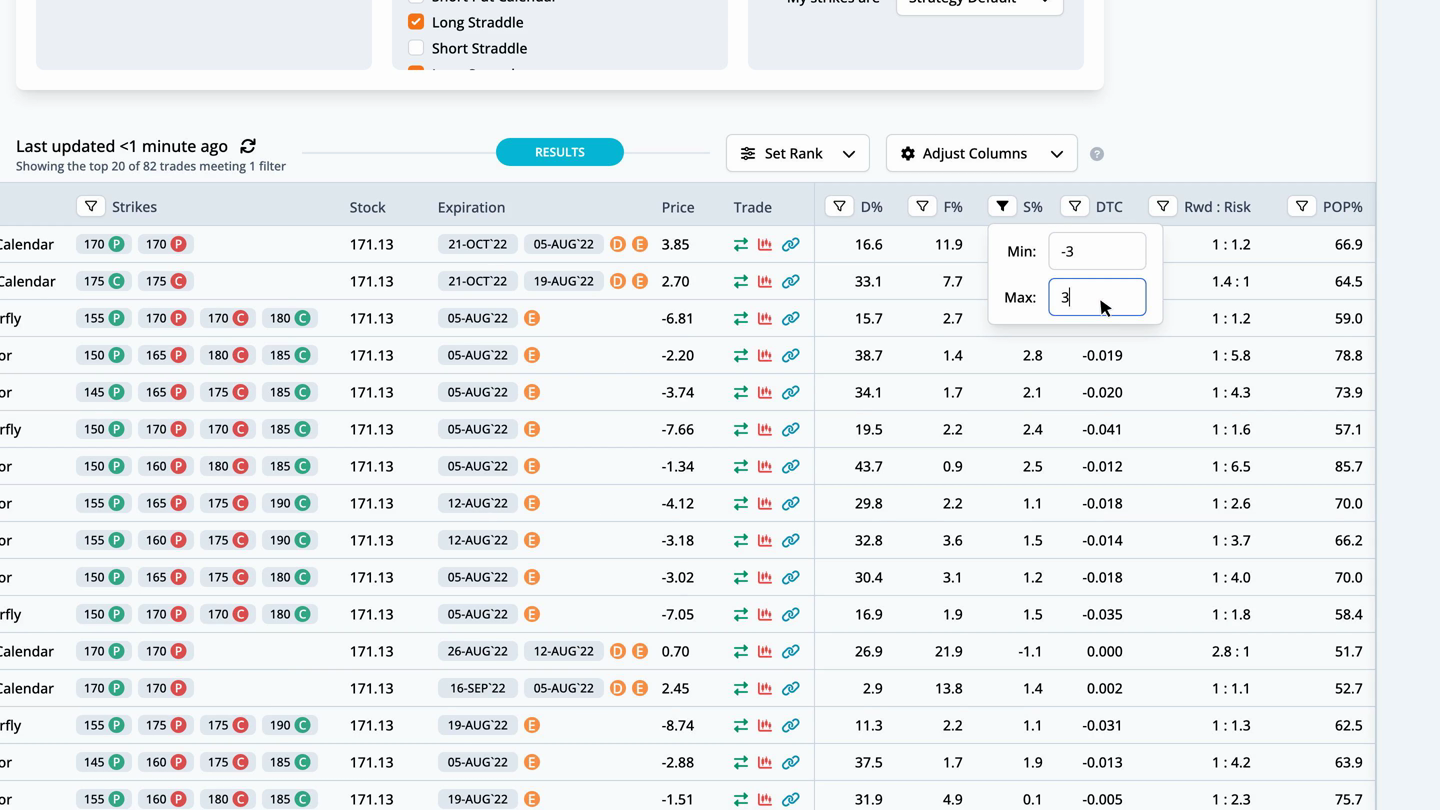
For PEP, the current PE ratio is 27.0, which is 26.9% over the average for the last twelve earnings observations. Returning to the overview tab, we can quickly run a scan to find the best option trades. Since earnings are right around the corner, we scan for neutral strategies, then filter the scan results by S%, or smoothed edge, by setting it between negative and positive 3%.


DUBbKKDfKk9kc5udWB5NyR8Fox6HOvfLgOaSIjvW7ewZ2_1Roe-hyavq_tjJV1mDrQbCUzH6gsY7mam9olZZdk0cQg5_07yAdnmaLgijyjF40-57u2XSIY8qS_4IMh3yqEwPyWGElx83caGlI6g


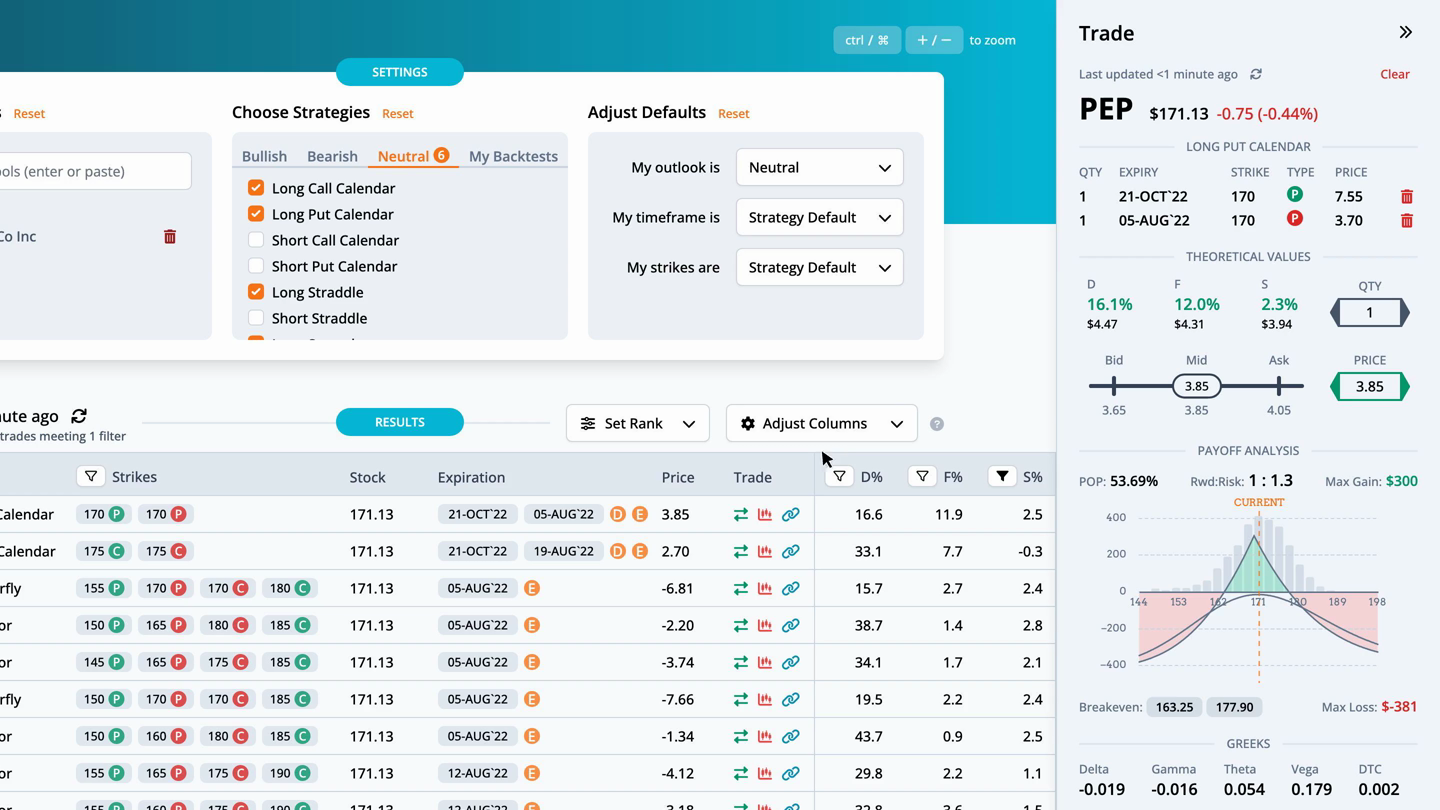
This helps narrow the results to trades that are fairly priced. The highest ranked trade is a Long Put Calendar with strikes at 170, expiring on Friday, October 21st and Friday, August 5th, for a debit of $3.85.


WYouVH8nDqV2R-TrsFEbXOM2pBm5idYEm4MxC_P17Qe6m_ruxk_qt57ytB3oblslLJZmvJECYJJ23eL15ZF9cO5AgUBuKVQYKQZilk9fSCCsh0IdOqypH5ccwYRyQLfMi08-_AsfjiOnRSJ3pI8


By pulling up the trade, we can see the theoretical values in more detail. The distribution edge, found by the expected value of the payoff picture on the stock's historical distribution, has an edge of 16.1%. The forecast edge, which is derived from historical volatility, has an edge of 12.0%. Lastly, the smoothed edge, which is calculated by drawing a best fit curve through the monthly implied volatilities, has an edge of 2.3%. The edge is relative to the mid-market price of the trade. Greater positive edges are a theoretical benefit to the trader. We can also look at the payoff graph. The probability of profit sums the probability of the nodes for the part of the payoff picture above the zero profit line over three standard deviations. For this trade the probability of profit is 53.69%. The reward to risk divides the max gain by the max loss. Here the 1 to 1.3 is the ratio of the max gain of $300 to the max loss of $-381. There are two break evens for this Long Put Calendar at 163.25 and 177.9. The total greeks and ThinkOrSwim code complete the information on the trade analysis popout.


zJEtMYTqqgQgVleRLi8x2F2mI2pXdLgS1rjVyBe-bBDbg61lVnJnUecsuUpG3PqG46xyGPMC-qRy4Fe23Q5QoS-5B2oDkotrixuKE3NDZXfRjw6ox0g1x9xdNo1KIQ1KiyTXvlE6u72dgp7sQ3Q


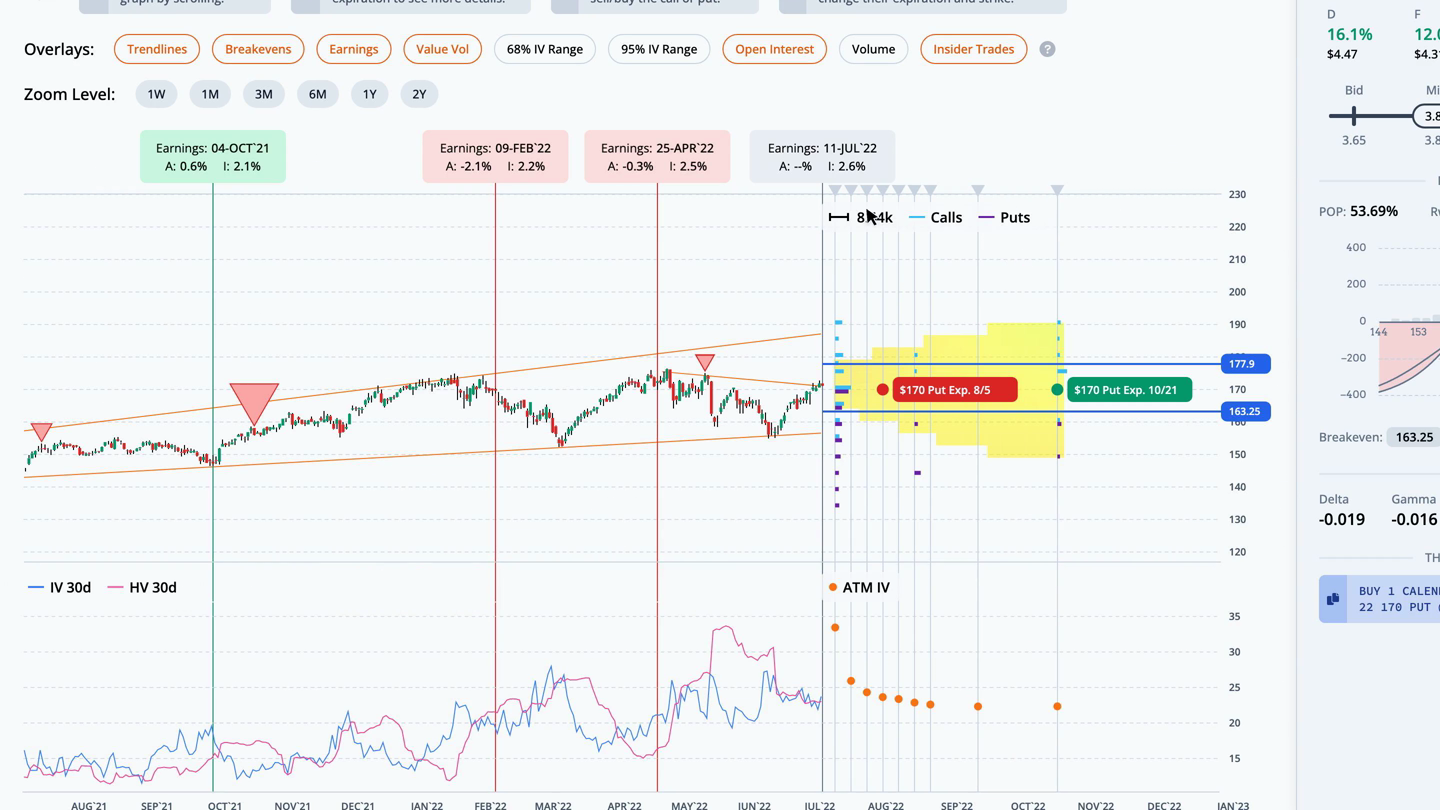
Next, let's look at this trade in the trade builder. Over the last month, the stock price rose 7.1%, while the thirty-day implied volatility fell 12.9%. The average slope of the trendlines is positive. The heatmap on the right side of the graph is green where volatility and slope are undervalued, and red where they are overvalued. In this case, short term IV and slope are neutral, while the long term is neutral.


o-Ll6NiI-j0bLjU6M2rTvzvpdNFAZgFU-mkVwSUISYyZp3WswmC78Rd1X1y4h2kKMBLWUwpMIoWsWQ4oCTRM9f-3ac76k-G8Ho-shw1hEsTWwhfHt286sWfmWSCYFxQNudbgZYhBgQbhObvqq0I


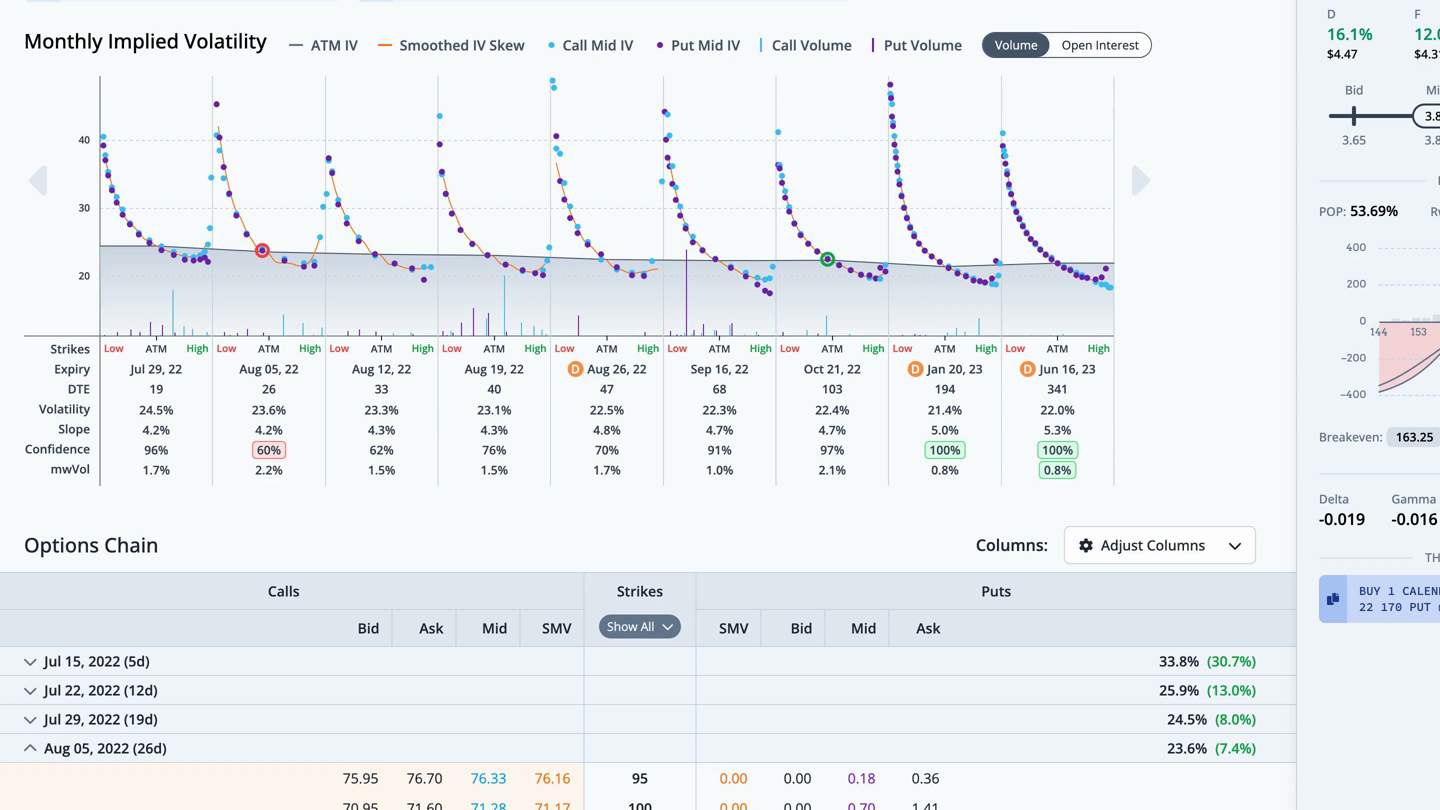
We can also see this trade overlaid on the monthly implied volatility graph in the chain tab. The legs for this trade are circled. For any questions or issues with the article, please contact otto@orats.com. To subscribe to the dashboard, please visit https://orats.com/dashboard
 
Morgan Stanley (MS) Earnings Report

Welcome to the ORATS earnings report where we scan for companies with upcoming earnings announcements, check out historical earnings information, and find a potential options trade.


Read on or watch the video overview here:
.


Let's start by running a scan on stocks reporting earnings this week, which includes the total option volume indicator, sorted from greatest to least.


MsvSPRhPx3CxnJtFN4aKlXuLTy5F4gy1ybnSQusb4witQA9abt7wSkN8v_V0kuzIXvmyPPDav7uLEmVWJ6Wp-1hB_WEagcCR7ra5GJvWLbz-xTW9mghiaFrVbs2u-m3D9bq7_l2of3FYnMpOplE


Focusing on Morgan Stanley, as we click through, we see this large-cap company in the capital markets industry reports earnings on Thursday, July 14th, before the open.


zCaMhkavw9CHBAPlbqqOKH_X2zFQaAsIcgho_Dnbi6zk3Jgnd7vA6eYukRFf-Flj86uDhRZZ0wlZzCCa9e_ihXhM9-HjuLPpLAStcze-qp4fPV4rtTIccdQaZPz8uXhPvISdQbkAXgMp6K--Ko0


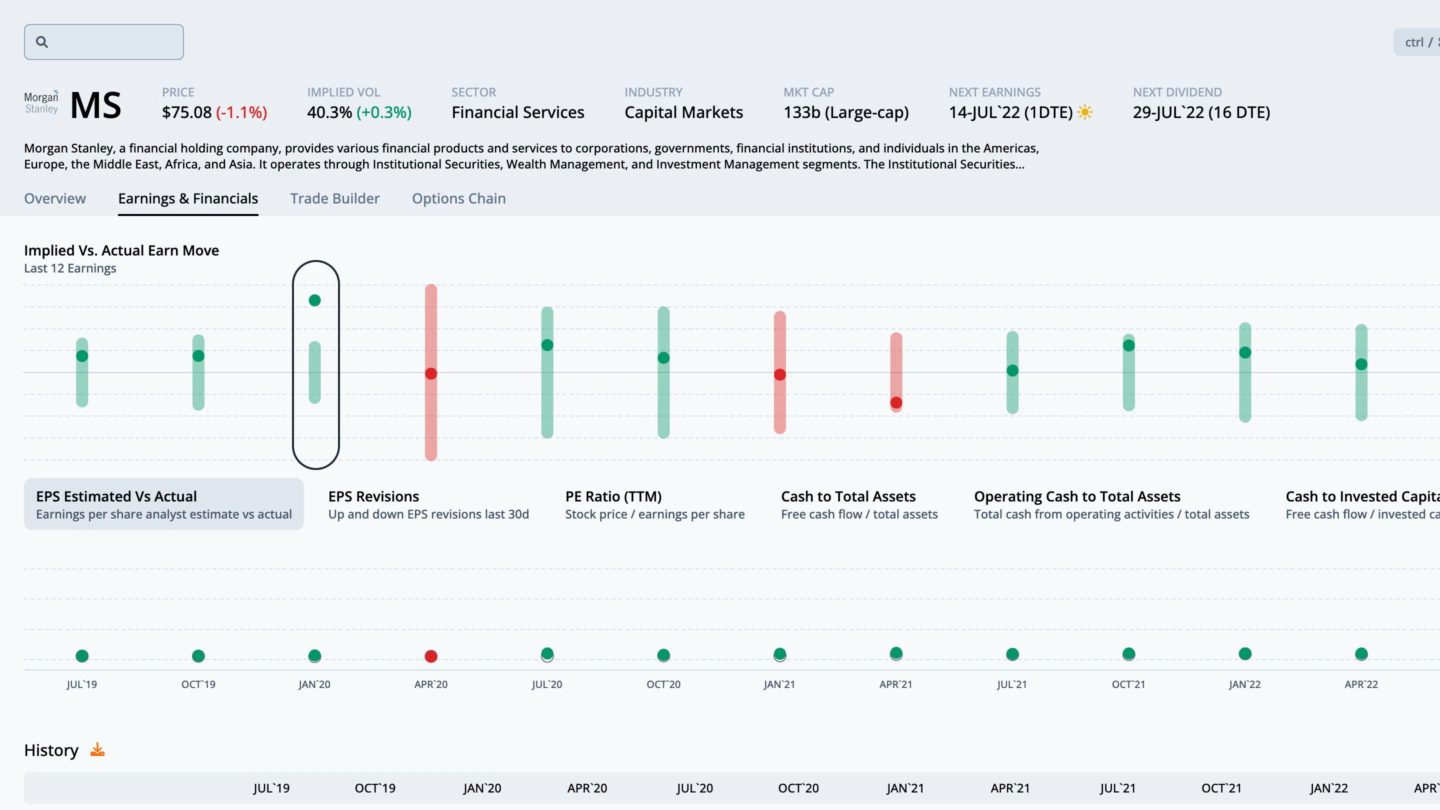
The earnings and financials tab takes us to more detail showing the options market expecting a move of 4.2% in either direction. This move was breached in 1 out of the last 12 earnings.


ru1kmSBCl7Q7-o4azaiZBFXNW4326Xl1NHaqcQoQY_FNr5y1QmD52-JLBnRJ2wvlRRlHFI9TRTFx99pHFKGfy8K-5_Wkz9PvD81zO3mqxWXKgQAWs2csYzgaddz4q8lsoFJCr9BB0LxpoYneavs


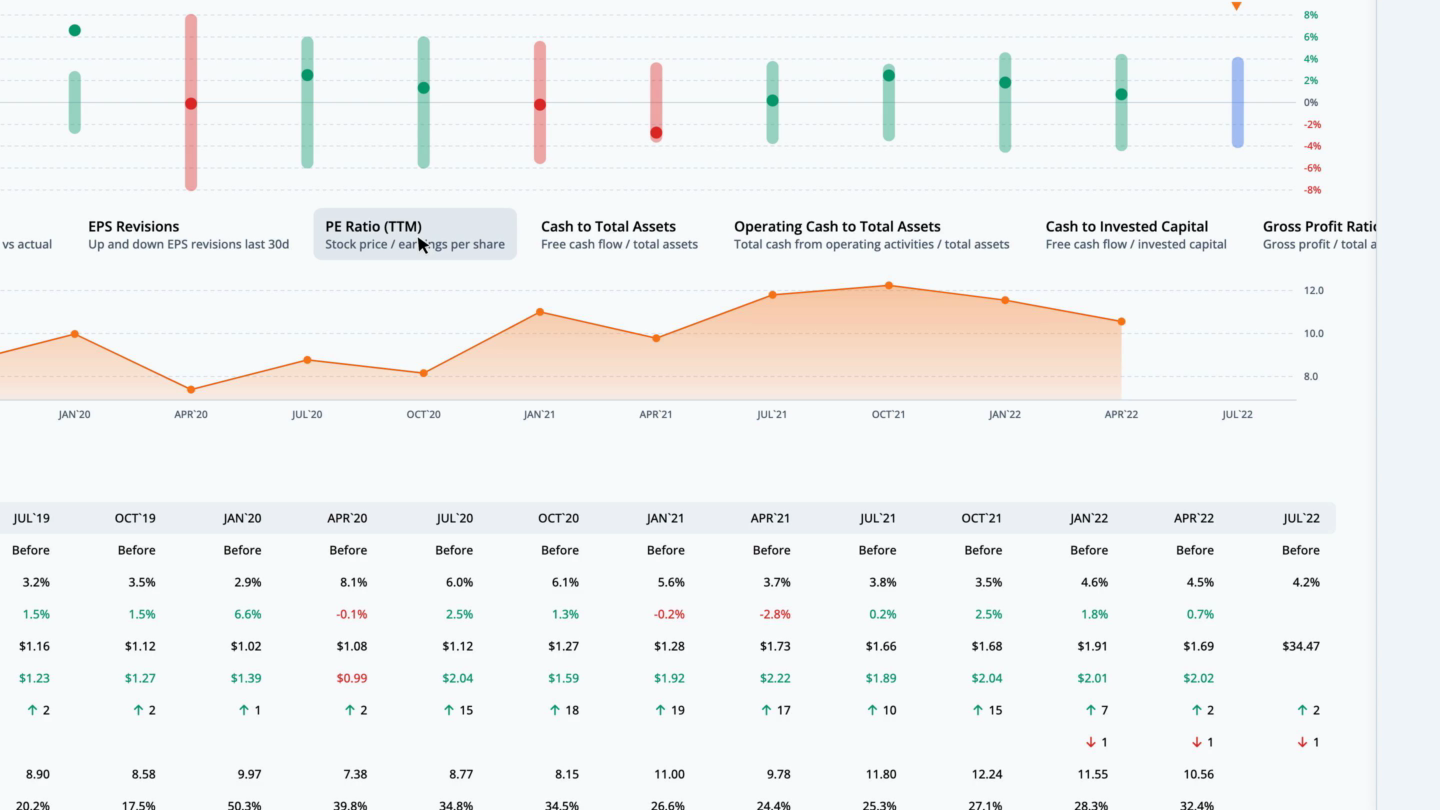
During that time, the post-earnings move was outside of the implied range 1 times. In those cases, long straddles were profitable. The rest of the earnings moves likely yielded profitable short straddles. We can overlay quarterly financial data by clicking on the ratios below the earn move graph. Let's look at the PE ratio, which is the stock price divided by the trailing twelve months earnings per share.


40EMAtG7jJPTcVQPuSHWfEFQ7yfxPtWxYNEjnK4iLnLkPmRp4xXth8nvu7QwprGZOsfXGrQv0HC_D1qAlmpSu6qpQcACi7Gm6_Bmw2Ri4qfadpn-M4RCCoi4NP7GySzop8gDuMy0j_4xwsusbPo


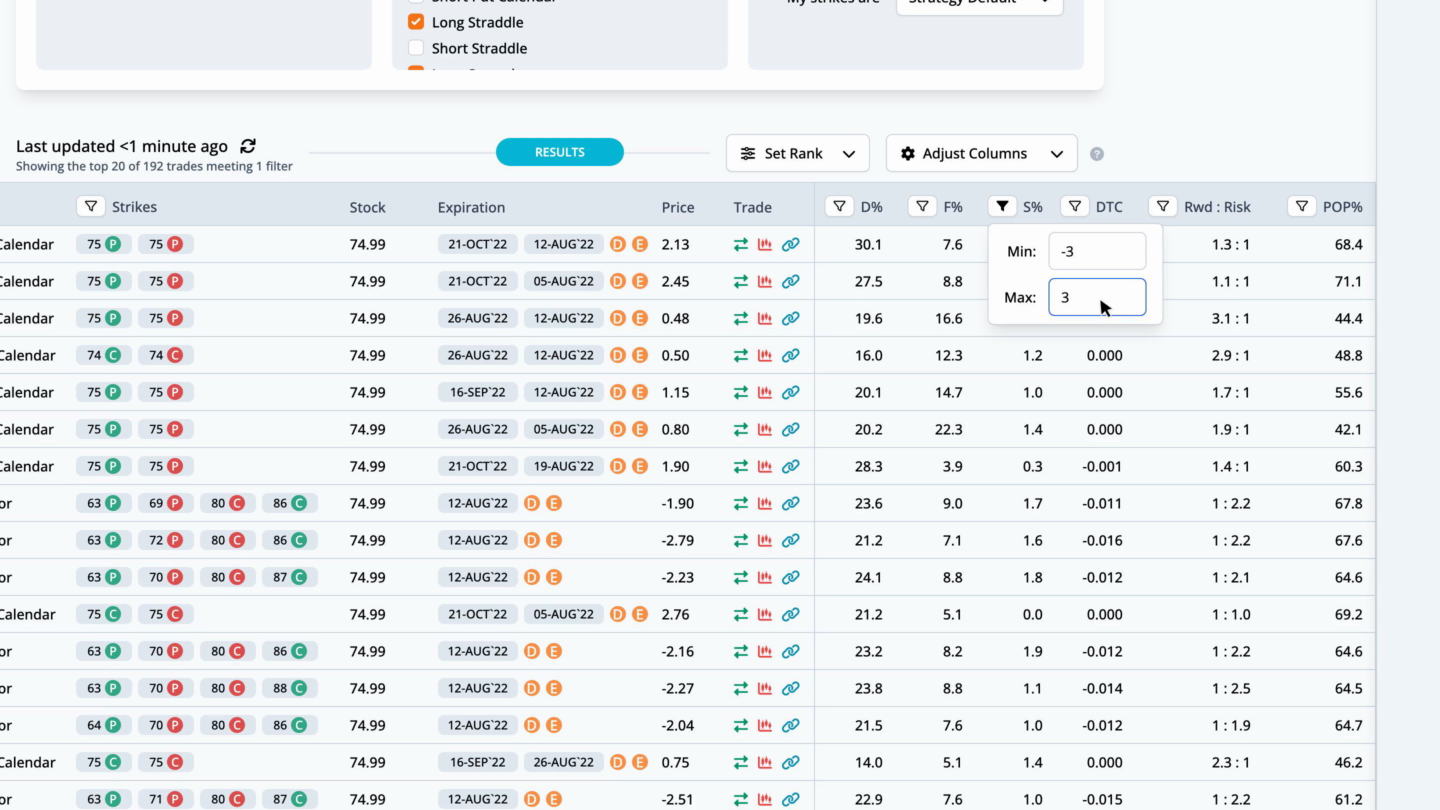
For MS, the current PE ratio is 9.4, which is 16.0% over the average for the last twelve earnings observations. Returning to the overview tab, we can quickly run a scan to find the best option trades. Since earnings are right around the corner, we scan for neutral strategies, then filter the scan results by S%, or smoothed edge, by setting it between negative and positive 3%.


tHoMWQpgQiEg4W__4HKyKslfdiKyzX8_9mljOToYQDGDsxuuF6zMMuzBTGBNiuLrIx_uyMM3lFIh844BgqWGfkB0VnUTB18-BnwG9BTMgKmBTgUfxKogtRbQeGXxjmRN6M9Vspbowz7DpJSbS_4


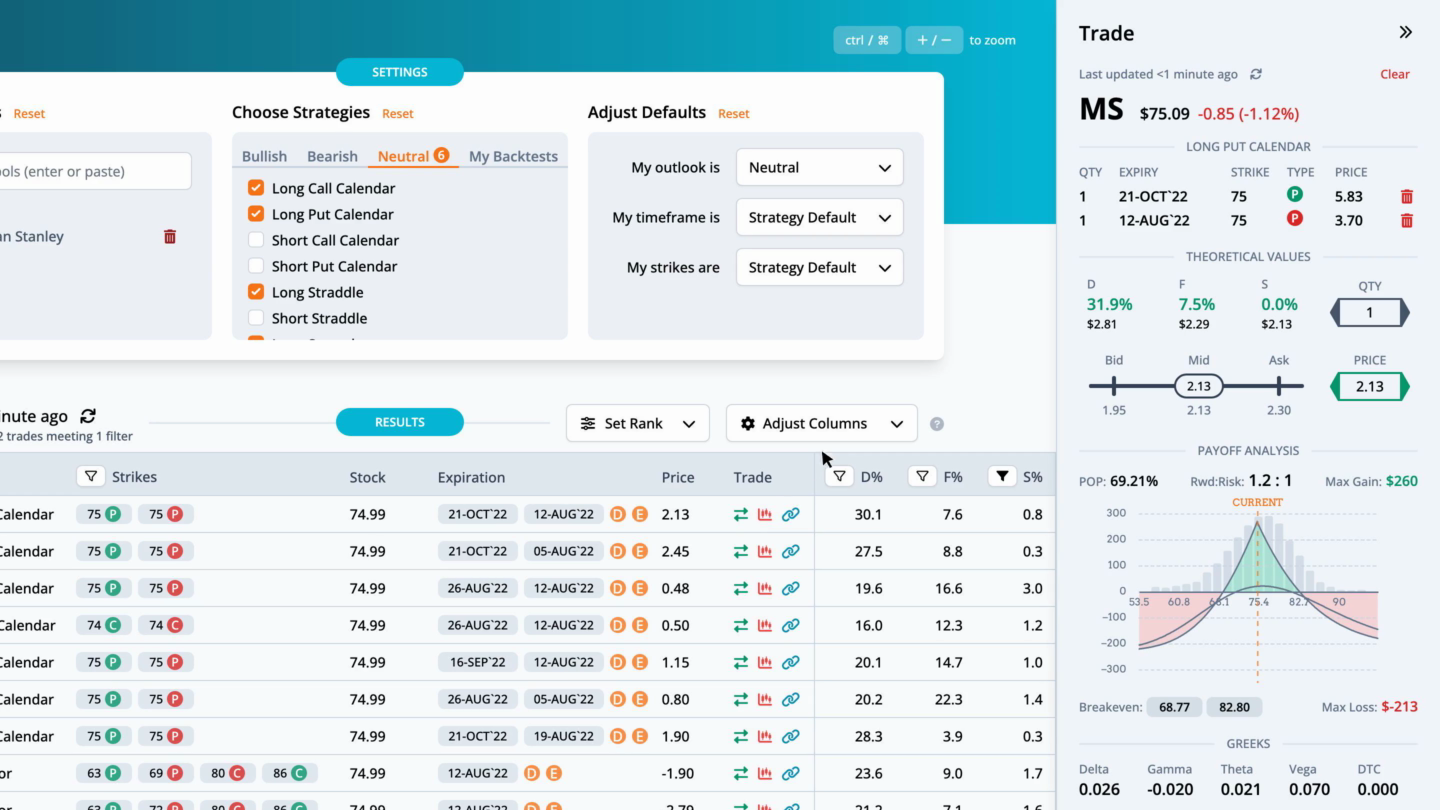
This helps narrow the results to trades that are fairly priced. The highest ranked trade is a Long Put Calendar with strikes at 75, expiring on Friday, October 21st and Friday, August 12th, for a debit of $2.13.

Ni9QOct_HzmIDcij5vjrIhx3dNrUrRzqRONsvl5TVEH0fBffrKG6smmoCt6cozspugxwlQsrMQMCYk-j4Mtii87ae_n9hFbIH1rnUu_Lg7X6yYRFUm7O9qn-FntV9VVgA7qrPVKF8v9hY-P5Vms


By pulling up the trade, we can see the theoretical values in more detail. The distribution edge, found by the expected value of the payoff picture on the stock's historical distribution, has an edge of 31.9%. The forecast edge, which is derived from historical volatility, has an edge of 7.5%. Lastly, the smoothed edge, which is calculated by drawing a best fit curve through the monthly implied volatilities, has an edge of 0.0%. The edge is relative to the mid-market price of the trade. Greater positive edges are a theoretical benefit to the trader. We can also look at the payoff graph. The probability of profit sums the probability of the nodes for the part of the payoff picture above the zero profit line over three standard deviations. For this trade the probability of profit is 69.21%. The reward to risk divides the max gain by the max loss. Here the 1.2 to 1 is the ratio of the max gain of $260 to the max loss of $-213. There are two break evens for this Long Put Calendar at 68.77 and 82.8. The total greeks and ThinkOrSwim code complete the information on the trade analysis popout.

EZidRpmkH38HpN04DWkeYSbrt0fhV13II39MUbzlW6QRtvHu6gaW_3vOC0N31MnkpAl9n-8FKbkJUkY-Eahsw24MRupBCK9pf9e07OQ-Dk4DfmdfToghbfbIELiaxIO6-7Mpz7WnvzALzmYTUHM


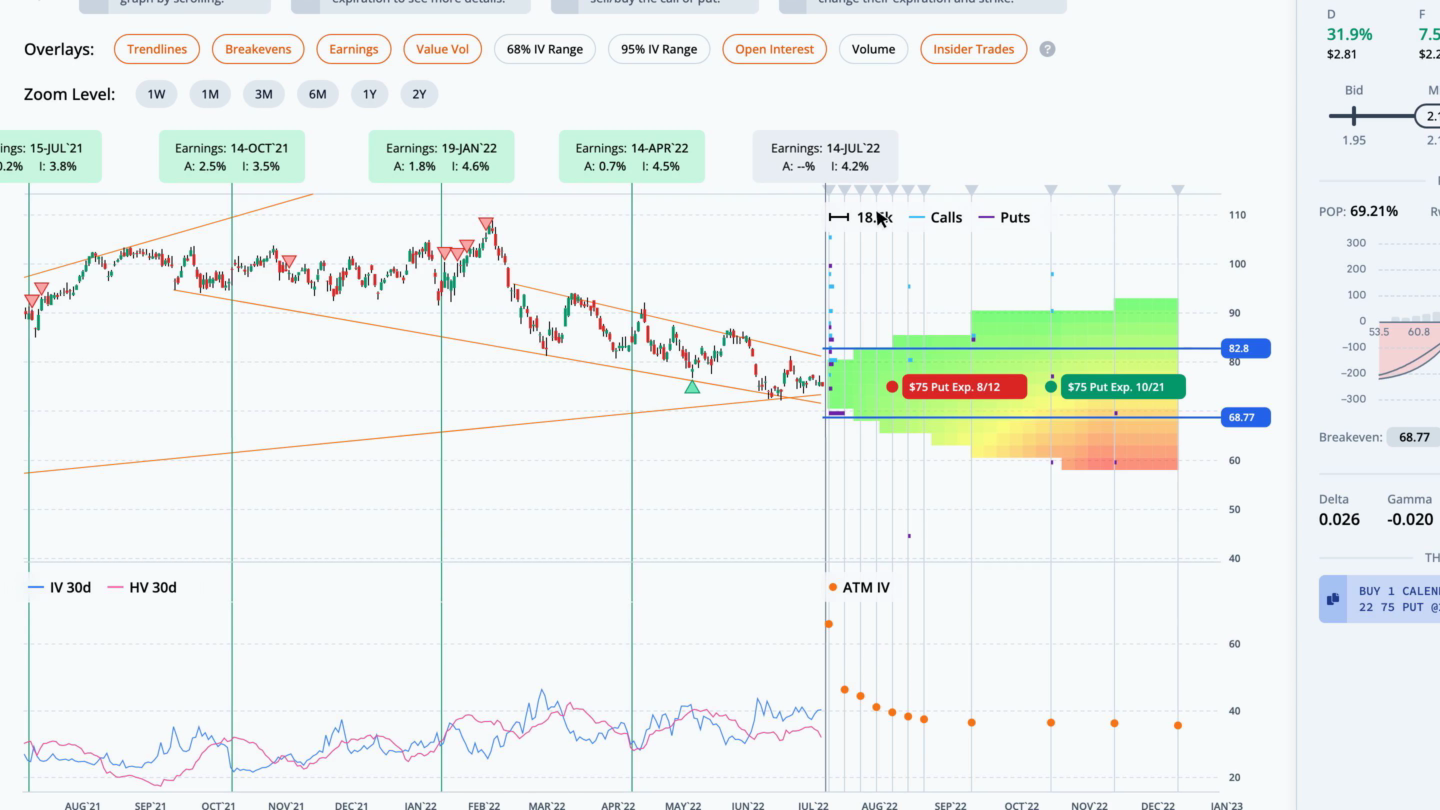
Next, let's look at this trade in the trade builder. Over the last month, the stock price rose 0.2%, while the thirty-day implied volatility fell 3.7%. The average slope of the trendlines is negative. The heatmap on the right side of the graph is green where volatility and slope are undervalued, and red where they are overvalued. In this case, short term IV and slope are undervalued, while the long term is overvalued.


6G1vParSRXzuNxMgDG-7PXdCnB-9WyhO5DeK6oqHwp9U3C16FNQC4XIURA3qKh6cH-1f-8Ec6nThterOoZppXgOKMsnpQrZezzt7lxfJNjdlI0wDFVeJQPgI4HfwAP0fZ1aWL3SHqcgqVgCxUGA


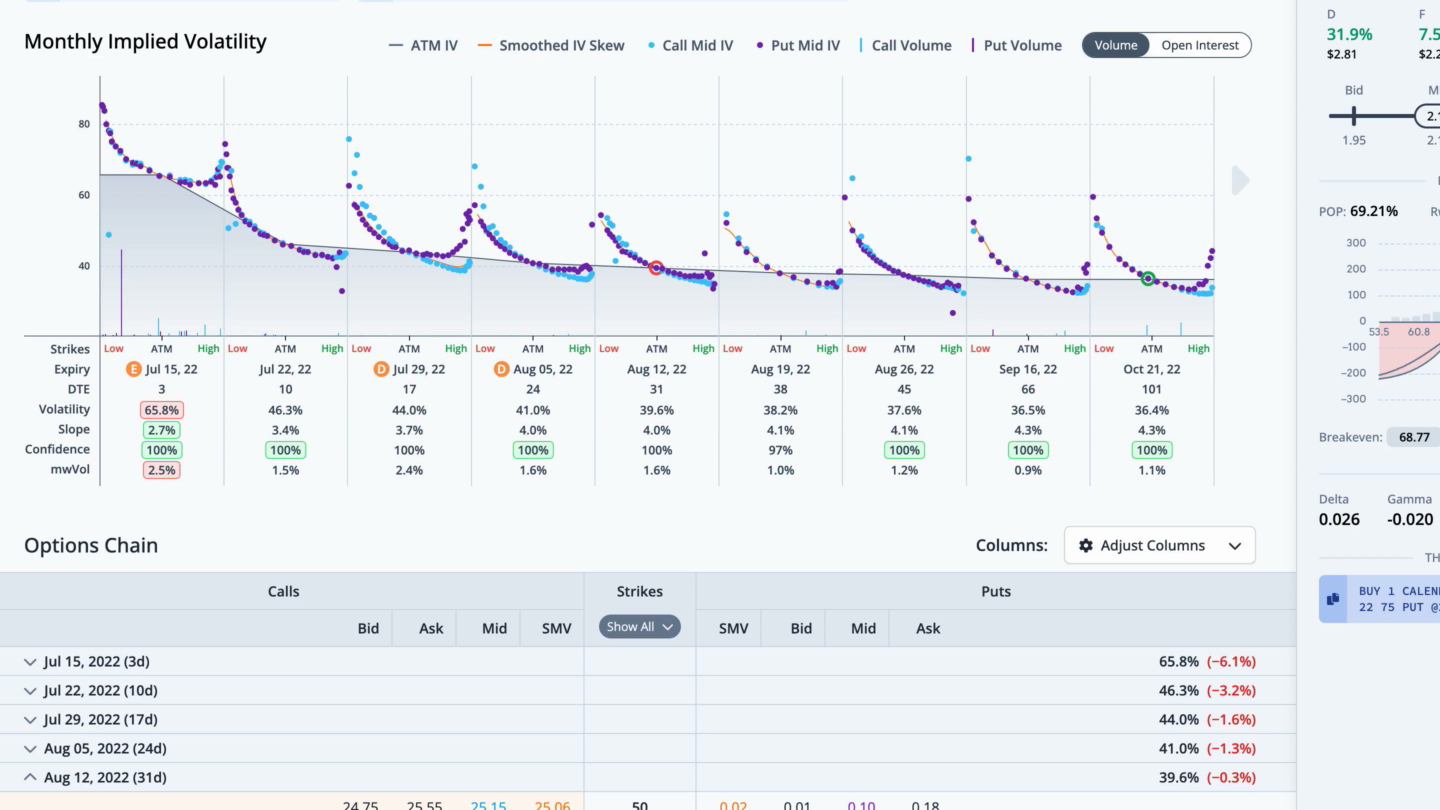
We can also see this trade overlaid on the monthly implied volatility graph in the chain tab. The legs for this trade are circled. For any questions or issues with the article, please contact otto@orats.com. To subscribe to the dashboard, please visit https://orats.com/dashboard


Disclaimer:

The opinions and ideas presented herein are for informational and educational purposes only and should not be construed to represent trading or investment advice tailored to your investment objectives. You should not rely solely on any content herein and we strongly encourage you to discuss any trades or investments with your broker or investment adviser, prior to execution. None of the information contained herein constitutes a recommendation that any particular security, portfolio, transaction, or investment strategy is suitable for any specific person. Option trading and investing involves risk and is not suitable for all investors.

 
International Business Machines (IBM) Earnings Report Monday, July 18th After
Welcome to the ORATS earnings report where we scan for companies with upcoming earnings announcements, check out historical earnings information, and find a potential options trade.

Read on or watch the video overview here:
.

Let's start by running a scan on stocks reporting earnings this week, which includes the total option volume indicator, sorted from greatest to least.

International%20Business%20Machines%20(IBM)%20Earnings%20Report-1.png


Focusing on International Business Machines, as we click through, we see this large-cap company in the information technology services industry reports earnings on Monday, July 18th, after the close.

International%20Business%20Machines%20(IBM)%20Earnings%20Report-Jul-18-2022-02-42-31-41-PM.png


The earnings and financials tab takes us to more detail showing the options market expecting a move of 5.7% in either direction. This move was breached in 4 out of the last 12 earnings.


International%20Business%20Machines%20(IBM)%20Earnings%20Report-Jul-18-2022-02-42-32-28-PM.png


During that time, the post-earnings move was outside of the implied range 6 times. In those cases, long straddles were profitable. The rest of the earnings moves likely yielded profitable short straddles. We can overlay quarterly financial data by clicking on the ratios below the earn move graph. Let's look at the PE ratio, which is the stock price divided by the trailing twelve months earnings per share.

International%20Business%20Machines%20(IBM)%20Earnings%20Report-2.png


For IBM, the current PE ratio is 14.5, which is 52.3% over the average for the last twelve earnings observations. Returning to the overview tab, we can quickly run a scan to find the best option trades. Since earnings are right around the corner, we scan for neutral strategies, then filter the scan results by S%, or smoothed edge, by setting it between negative and positive 3%.

International%20Business%20Machines%20(IBM)%20Earnings%20Report-3.png


This helps narrow the results to trades that are fairly priced. The highest ranked trade is a Long Call Calendar with strikes at 141, expiring on Friday, August 26th and Friday, August 12th, for a debit of $0.25.

International%20Business%20Machines%20(IBM)%20Earnings%20Report-Jul-18-2022-02-42-31-76-PM.png


By pulling up the trade, we can see the theoretical values in more detail. The distribution edge, found by the expected value of the payoff picture on the stock's historical distribution, has an edge of 90.7%. The forecast edge, which is derived from historical volatility, has an edge of 45.3%. Lastly, the smoothed edge, which is calculated by drawing a best fit curve through the monthly implied volatilities, has an edge of 2.7%. The edge is relative to the mid-market price of the trade. Greater positive edges are a theoretical benefit to the trader. We can also look at the payoff graph. The reward to risk divides the max gain by the max loss. Here the 12.6 to 1 is the ratio of the max gain of $316 to the max loss of $-25. There are two break evens for this Long Call Calendar at 132.4 and 151.1. The total greeks and ThinkOrSwim code complete the information on the trade analysis popout.

International%20Business%20Machines%20(IBM)%20Earnings%20Report.png


Next, let's look at this trade in the trade builder. Over the last month, the stock price rose 1.3%, while the thirty-day implied volatility rose 17.3%. The average slope of the trendlines is negative. The heatmap on the right side of the graph is green where volatility and slope are undervalued, and red where they are overvalued. In this case, short term IV and slope are slightly overvalued, while the long term is very overvalued.

International%20Business%20Machines%20(IBM)%20Earnings%20Report-4.png


We can also see this trade overlaid on the monthly implied volatility graph in the chain tab. The legs for this trade are circled. For any questions or issues with the article, please contact otto@orats.com. To subscribe to the dashboard, please visit https://orats.com/dashboard

Disclaimer:

The opinions and ideas presented herein are for informational and educational purposes only and should not be construed to represent trading or investment advice tailored to your investment objectives. You should not rely solely on any content herein and we strongly encourage you to discuss any trades or investments with your broker or investment adviser, prior to execution. None of the information contained herein constitutes a recommendation that any particular security, portfolio, transaction, or investment strategy is suitable for any specific person. Option trading and investing involves risk and is not suitable for all investors.
 
Twitter (TWTR) Earnings Report Friday, July 22nd
https://blog.orats.com/twitter-twtr-earnings-report-friday-july-22nd

Welcome to the ORATS earnings report where we scan for companies with upcoming earnings announcements, check out historical earnings information, and find a potential options trade.

Read on or watch the video overview here:

Let's start by running a scan on stocks reporting earnings this week, which includes the total option volume indicator, sorted from greatest to least.

Twitter%20(TWTR)%20Earnings%20Report.png


Focusing on Twitter, as we click through, we see this large-cap company in the internet content and information industry reports earnings on Friday, July 22nd, before the open.

Twitter%20(TWTR)%20Earnings%20Report-Jul-19-2022-10-48-19-27-PM.png


The earnings and financials tab takes us to more detail showing the options market expecting a move of 3.9% in either direction. This move was breached in 8 out of the last 12 earnings.

Twitter%20(TWTR)%20Earnings%20Report-1.png


During that time, the post-earnings move was outside of the implied range 4 times. In those cases, long straddles were profitable. The rest of the earnings moves likely yielded profitable short straddles. We can overlay quarterly financial data by clicking on the ratios below the earn move graph. Let's look at the PE ratio, which is the stock price divided by the trailing twelve months earnings per share.

Twitter%20(TWTR)%20Earnings%20Report-Jul-19-2022-10-48-18-40-PM.png


For TWTR, the current PE ratio is 44.3, which is 30.9% over the average for the last twelve earnings observations. Returning to the overview tab, we can quickly run a scan to find the best option trades. Since earnings are right around the corner, we scan for neutral strategies, then filter the scan results by S%, or smoothed edge, by setting it between negative and positive 3%.

Twitter%20(TWTR)%20Earnings%20Report-3.png


This helps narrow the results to trades that are fairly priced. The highest ranked trade is a Iron Butterfly with strikes at 32.5, 40, and 48, expiring on 2022-08-19, for a credit of $3.6.

Twitter%20(TWTR)%20Earnings%20Report-2.png


By pulling up the trade, we can see the theoretical values in more detail. The distribution edge, found by the expected value of the payoff picture on the stock's historical distribution, has an edge of 14.7%. The forecast edge, which is derived from historical volatility, has an edge of -24.7%. Lastly, the smoothed edge, which is calculated by drawing a best fit curve through the monthly implied volatilities, has an edge of 1.7%. The edge is relative to the mid-market price of the trade. Greater positive edges are a theoretical benefit to the trader. We can also look at the payoff graph. The probability of profit sums the probability of the nodes for the part of the payoff picture above the zero profit line over three standard deviations. For this trade the probability of profit is 64.58%. The reward to risk divides the max gain by the max loss. Here the 1 to 1.2 is the ratio of the max gain of $360 to the max loss of $-440. There are two break evens for this Iron Butterfly at 36.4 and 43.6. The total greeks and ThinkOrSwim code complete the information on the trade analysis popout.

Twitter%20(TWTR)%20Earnings%20Report-Jul-19-2022-10-48-18-79-PM.png


Next, let's look at this trade in the trade builder. Over the last month, the stock price rose 1.4%, while the thirty-day implied volatility fell 27.2%. The average slope of the trendlines is negative. The heatmap on the right side of the graph is green where volatility and slope are undervalued, and red where they are overvalued. In this case, short term IV and slope are undervalued, while the long term is slightly overvalued.

Twitter%20(TWTR)%20Earnings%20Report-4.png


We can also see this trade overlaid on the monthly implied volatility graph in the chain tab. The legs for this trade are circled. For any questions or issues with the article, please contact otto@orats.com. To subscribe to the dashboard, please visit https://orats.com/dashboard

Disclaimer:

The opinions and ideas presented herein are for informational and educational purposes only and should not be construed to represent trading or investment advice tailored to your investment objectives. You should not rely solely on any content herein and we strongly encourage you to discuss any trades or investments with your broker or investment adviser, prior to execution. None of the information contained herein constitutes a recommendation that any particular security, portfolio, transaction, or investment strategy is suitable for any specific person. Option trading and investing involves risk and is not suitable for all investors.
 
Back
Top