You are using an out of date browser. It may not display this or other websites correctly.
You should upgrade or use an alternative browser.
You should upgrade or use an alternative browser.
Duration ratio between the US 30y and the 10y since the 70's?
- Thread starter Daal
- Start date
you can approximate in excel if rough calcs are fine for you with =DURATION(C7, C7+365*30, D7, D7, 2) where c7 = observation date, d7 = 30y yield on the observation date. The ratio will asymptotically decrease as yields go higher. In the below red assumes that 30y yield = 10y yield and blue that 30y = 10y yield + 1.5%
Attachments
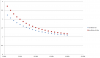
Have you plugged historical data in to see how that evolved?you can approximate in excel if rough calcs are fine for you with =DURATION(C7, C7+365*30, D7, D7, 2) where c7 = observation date, d7 = 30y yield on the observation date. The ratio will asymptotically decrease as yields go higher. In the below red assumes that 30y yield = 10y yield and blue that 30y = 10y yield + 1.5%
I found some data here
https://www.portfoliovisualizer.com/backtest-asset-class-allocation#analysisResults
It didn't had yields but annual returns. Looking at the ratio between long-term treasury % changes and 10y treasury % changes (and removing the negative ratios), I'm getting a 1.75 ratio of long-term treasury to 10y treasury
Hi tks for the chart. can you tell what you mean by this? I haven't changed 30 to 10?
no, nothing, that bit of msg wasn't directed at you.Hi tks for the chart. can you tell what you mean by this? I haven't changed 30 to 10?