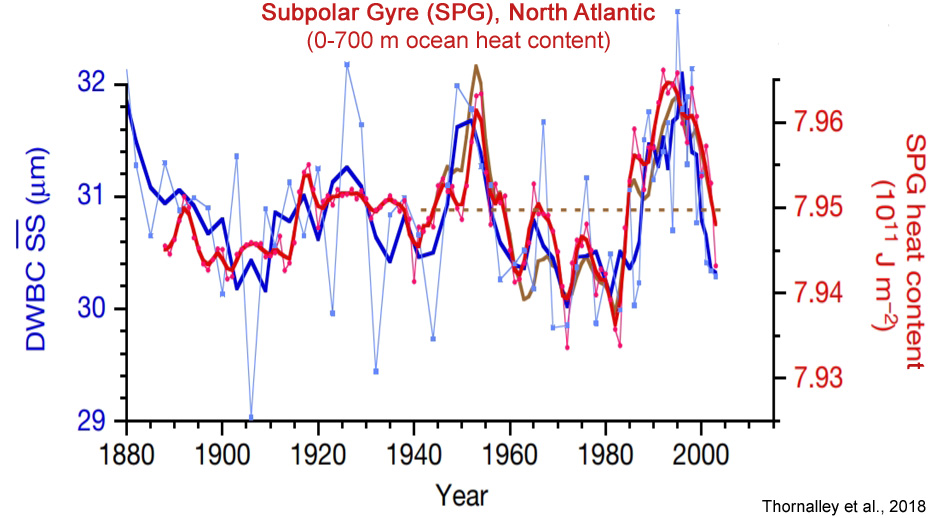
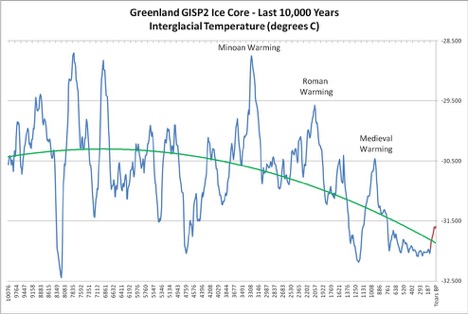
You are an asshole fraudcurrents for calling me a liar and then pasting stale charts.
And don't argue with the website read the studies... they are real. If you have a problem show us the the temps have not been dropping in these areas.
http://notrickszone.com/2018/07/04/...l-down-and-growing-arctic-sea-ice-may-follow/
Warming changes over to cooling
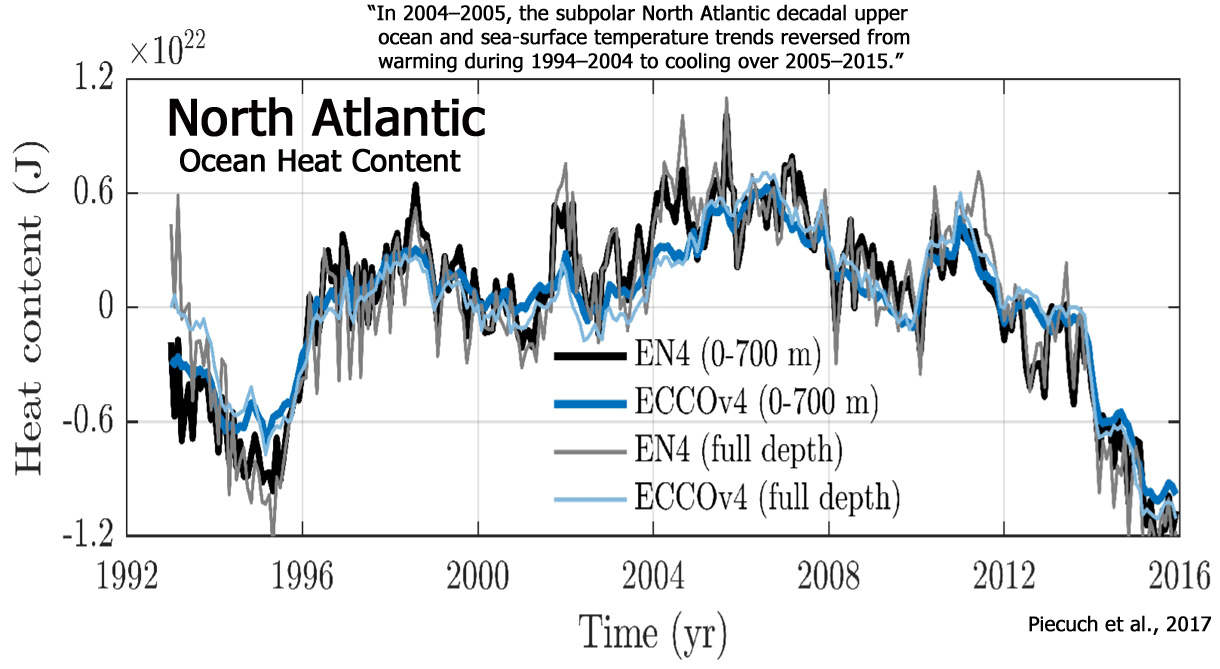
Another team of scientists led by Christopher G. Piecuch published a study in the journal Geophysical Research Letters here which shows that the subpolar North Atlantic (SPNA) upper ocean and sea‐surface temperature trends reversed from warming during 1994–2004 to cooling over 2005–2015.
The authors write that the region “is subject to strong decadal variability”, meaning natural cycles are at play. The authors present the following chart, which shows that the North Atlantic heat content has fallen sharply since 2010.
1. Your chart is a segment of time in the middle of the range and its seems dated. The current literature shows the temps have fallen dramatically recently.
you are an asshole for calling me a liar.
2. besides .6 degrees which could be entirely do to monitoring changes.
3. None of the warming has been shown to be caused by man made co2.
4. Right now studies I have read speak to the cycles of Tidal system impacting temperature of the short term like this.
5. Who the hell are you to determine the date ranges and your chart are more relevant? In the next post will be a chart measuring zero to 700 meters and its updated.
And don't argue with the website read the studies... they are real. If you have a problem show us the the temps have not been dropping in these areas.
http://notrickszone.com/2018/07/04/...l-down-and-growing-arctic-sea-ice-may-follow/
Warming changes over to cooling
Another team of scientists led by Christopher G. Piecuch published a study in the journal Geophysical Research Letters here which shows that the subpolar North Atlantic (SPNA) upper ocean and sea‐surface temperature trends reversed from warming during 1994–2004 to cooling over 2005–2015.
The authors write that the region “is subject to strong decadal variability”, meaning natural cycles are at play. The authors present the following chart, which shows that the North Atlantic heat content has fallen sharply since 2010.
1. Your chart is a segment of time in the middle of the range and its seems dated. The current literature shows the temps have fallen dramatically recently.
you are an asshole for calling me a liar.
2. besides .6 degrees which could be entirely do to monitoring changes.
3. None of the warming has been shown to be caused by man made co2.
4. Right now studies I have read speak to the cycles of Tidal system impacting temperature of the short term like this.
5. Who the hell are you to determine the date ranges and your chart are more relevant? In the next post will be a chart measuring zero to 700 meters and its updated.
Oh shut the fuck up jem you liar with the bullshit irrelevant time scale chart. You lying sack of shit.

Last edited: