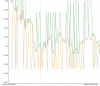
I'm attempting to construct minute aggregated bid/ask spreads from the IEX TOPS data. To check my work I plotted AAPL to see if it makes sense. The green trace is ask, the orange is bid. As a cross-check I included a blue trace for close from the chart API.
Correct me if I'm wrong but what seems to be going on is people are coming in making market orders that spike the bid up and/or ask down, upon which the market maker(s) come(s) in to re-establish the spread -- usually doing so at the prior market-making price. Occasionally, if there are enough market orders on one side, the market maker will not return to the prior price but will adjust to a new market making baseline price.
Correct me if I'm wrong but what seems to be going on is people are coming in making market orders that spike the bid up and/or ask down, upon which the market maker(s) come(s) in to re-establish the spread -- usually doing so at the prior market-making price. Occasionally, if there are enough market orders on one side, the market maker will not return to the prior price but will adjust to a new market making baseline price.
Attachments
Last edited:

