You are using an out of date browser. It may not display this or other websites correctly.
You should upgrade or use an alternative browser.
You should upgrade or use an alternative browser.
Do you know how to calculate "Willtrend"?
- Thread starter xenosaga
- Start date


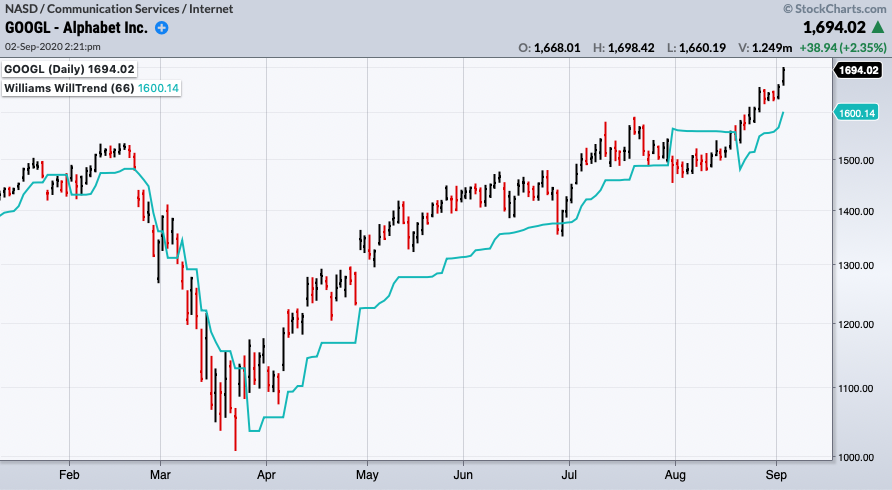
The WillTrend indicator is described here, and it resembles a SuperTrend:
https://support.stockcharts.com/doku.php?id=acp:plugins:lwstarter
so the formula could be this:
-----------------------------------------------------------------------------------------
{WillTrend by Larry Williams}
Inputs:
Period(66),
ATRMultiplication(2.236),
MidPriceVar(10);
Variables:
upperBand(0), lowerBand(0), atr(0), trail(0),
midPrice1(0), midPrice2(0), midPrice(0);
atr = AvgTrueRange(Period) * ATRMultiplication;
midPrice1=Lowest(low,MidPriceVar);
midPrice2= Highest(high,MidPriceVar);
midPrice= (midPrice1 + midPrice2)/2;
lowerBand= midPrice + atr;
upperBand= midPrice - atr;
trail = IFF(Close > trail[1] and Close[1] > trail[1], MaxList(trail[1], upperBand),
IFF(Close < trail[1] and Close[1] < trail[1], MinList(trail[1], lowerBand),
IFF(Close > trail[1], upperBand, lowerBand)));
Plot1(trail);
if (Close > trail) then
SetPlotColor(1, green)
else
SetPlotColor(1, red);
----------------------------------------------------------------------------------------------
fantastic!The WillTrend indicator is described here, and it resembles a SuperTrend:
https://support.stockcharts.com/doku.php?id=acp:plugins:lwstarter
so the formula could be this:
-----------------------------------------------------------------------------------------
{WillTrend by Larry Williams}
Inputs:
Period(66),
ATRMultiplication(2.236),
MidPriceVar(10);
Variables:
upperBand(0), lowerBand(0), atr(0), trail(0),
midPrice1(0), midPrice2(0), midPrice(0);
atr = AvgTrueRange(Period) * ATRMultiplication;
midPrice1=Lowest(low,MidPriceVar);
midPrice2= Highest(high,MidPriceVar);
midPrice= (midPrice1 + midPrice2)/2;
lowerBand= midPrice + atr;
upperBand= midPrice - atr;
trail = IFF(Close > trail[1] and Close[1] > trail[1], MaxList(trail[1], upperBand),
IFF(Close < trail[1] and Close[1] < trail[1], MinList(trail[1], lowerBand),
IFF(Close > trail[1], upperBand, lowerBand)));
Plot1(trail);
if (Close > trail) then
SetPlotColor(1, green)
else
SetPlotColor(1, red);
----------------------------------------------------------------------------------------------
No one was interested in Willtrend.
And you responded to the OP 13 years later.
Last edited:
%%Hello.
I wrote code of "Willtrend" in the textbook, but I deleated it by mistake
"Willtrend" is Larry Williams's indicator.
I remember somehow that it was resembled Volatility Stop...
Do you know how to calculate?
If you know, please tell me.
Thank you.
Williams % is like fast Sto..............................;
nothing like a good 10 year trend pattern
fantastic!
No one was interested in Willtrend.
And you responded to the OP 13 years later.
He's just a believer in better late, than never.