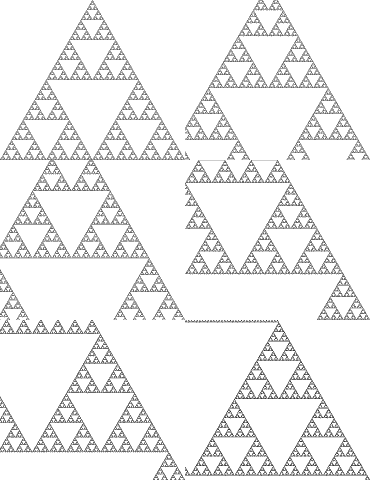
The markets are pseudo-fractal or fractal-like. The closest analogue would be the coastline "fractals" which, like the markets, are nonrepetitive but similar. Of course the biggest difference is that the markets have a smallest size. There is no scale smaller than tick-size. Still there may be something about fractal math that is applicable to markets. Mendelbrot thought so.Of course there are similarities across time frames BUT:
I doubt that many here have any precise idea what a fractal actually is, beyond the vague intuitive statement of the OP. Can any of the proponents of the fractal nature of price charts determine the fractal dimension of the S&P500 price history? In order to convince me of what you claim you need to supply a more scientific argument.
Any similarity of price chart time frames to fractals seems to be entirely in your own minds due to your own biased thinking and susceptibility to accept unproven ideas. Much like the way some people believe that ancient Egyptions used electric light bulbs.
This is what a real fractal looks like, the depth is infinite with the same patterns recurring unlike on a price chart.
http://www.jakebakermaths.org.uk/maths/mandelbrot/canvasmandelbrotv12.html
Last edited: