“Using Neural Networks to Predict Stock Prices” — Don’t Be Fooled
Many claim they can predict stock and cryptocurrency prices using machine learning; but no one can prove a profit on live data. What’s the catch?

Lee Schmalz
Aug 24, 2020·7 min read
Public Use Credit: pixabay.com
Note from Towards Data Science’s editors: While we allow independent authors to publish articles in accordance with our rules and guidelines, we do not endorse each author’s contribution. You should not rely on an author’s works without seeking professional advice. See our Reader Terms for details
If you’re reading this article, you’ve likely seen blog posts/articles online using stock/cryptocurrency data and machine learning algorithms to “predict” future prices. Here, I’ve demonstrated a similar project in which I use some metrics like Tweet Volume, Google Trends Volume, Market Cap, and Trading Volume to “predict” tomorrow’s opening price. In this example, we will focus on Bitcoin prices since it is a hot topic, but this can be extrapolated to any asset as long as the data is available. Naively, one may think on a day where people are tweeting about Bitcoin, Googling Bitcoin, and trading Bitcoin more than usual, we will likely see the price of Bitcoin open higher tomorrow than it did today. Further, maybe we can actually predict tomorrows opening price with high enough accuracy based on these data to ultimately yield a profitable trading algorithm. To test this hypothesis, I’ve gathered some data from Nomics, Google trends, and other free online sources to yield the following dataframe.
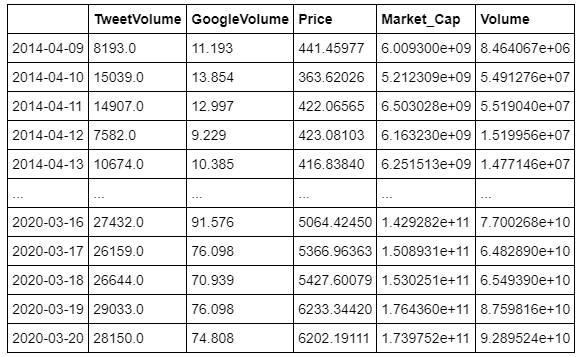
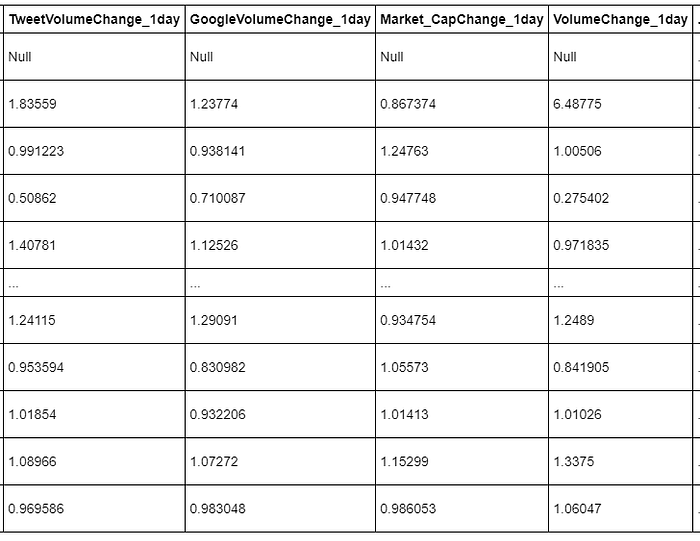
From a machine learning scope, we can think of these four mentioned columns as our feature set and our ‘Price’ column as our target. More specifically, tomorrow’s price is the target for today’s features. With a bit of feature engineering, we can also include changes in these metrics for the past day, past two days, past three days, etc, where a value greater than 1 indicates an increase and a value less than 1 indicates a decrease.
Engineered features to encode recent changes over time in a single instance
Linear Regression
Now that we have our dataset, let’s use some machine learning techniques to see if we can accurately predict tomorrow’s opening prices.
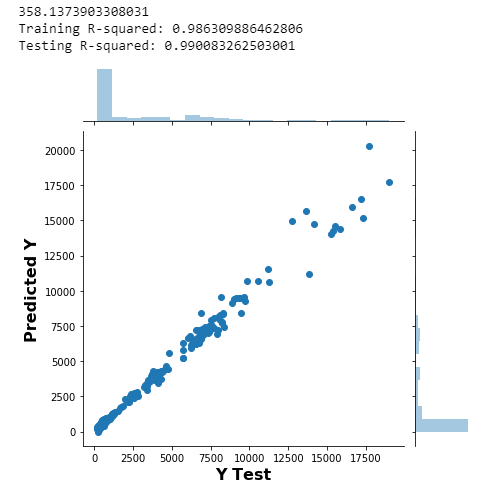
The code above performs a simple linear regression using Scikit-Learn and yields the following output:
Predicted Price versus Actual Price. R² = 0.99008. RMSE=358.12
If we plot our predicted prices and our actual prices along a time axis, we observe:
Predicted and Actual prices over time
Wow! This is incredible! Is it really that simple? All you have to do is get some search and volume data from online and use simple linear regression and you can accurately predict Bitcoin prices? Unfortunately, this is not the case. And even more unfortunately, so many people on the internet display results like these and claim to have the magic, get-rich-quick trading algorithm. Countless articles I see popping up day in and day out on various feeds use a trick like this along with some buzzwords like ‘Machine Learning’, ‘Artificial Intelligence’, and ‘Neural Networks’ to grab your attention to make you think they’re onto something. Did you catch the trick?
The trick here is that yesterday’s price is being fed into the model with the feature set (or commonly something similar like avg last 5 days). The model quickly learns that pinning the prediction at yesterdays price and then slightly nudging it up or down based on the other features to try to predict in the right direction is the best method. In general, this
could be a fine strategy. For example, if the other features were perfectly indicative of price movements, this would work great. Essentially your model would use yesterday’s price as a baseline and then predict a rise or a fall. If it could accurately predict this rise or fall like many claim to do, you can get rich quick! The major, deceptive problem here is the use of metrics like R² or RMSE between actual and predicted prices to show people “look how well my model predicts!”. Anyone coming from a background in statistics sees the 0.99 R² value as a indication of a model to be worshiped. Though in this context, the inclusion of previous prices in the training data guarantees this performance as evaluated by residual error. I’ve also seen instances where the header photo of the article/blog post is a plot similar to the plotly output shown above; further, there is no code included to show the reader that the previous prices were actually included in the regression algorithm. Had I run this same exact algorithm, but filled the volume features with randomly generated values and only included today’s price data as an informative feature, the output would look the same from a distance and the R² would also be extremely high. An even sneakier way to pull off a trick like this is to build a recurrent neural network or LSTM model with
n previous prices sequenced for each instance of the network and then failing to shuffle the training data. You tell the network to minimize loss, and the network quickly learns: “Hey look, if I use yesterday’s price for every prediction, the loss function minimizes!”.
Backtesting
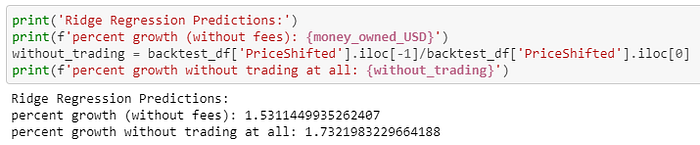
To further disprove the claimed profitability of a trading strategy like this one, I ran a few backtests to see what would have happened had you actually used these predictions to make daily Bitcoin trades. Here are the results for a similar Ridge Regression model that also had an R² value greater than 0.99. If you’d like to view the full details and code of the backtest, I’ve attached a link to the full notebook at the end of this article.
As you can see (to my disappointment), using Tweet Volume, Google Trends, Market Cap, and Trading Volume to predict tomorrow’s price actually performed worse than simply buying at the beginning and selling at the end of the backtesting interval even though the model evaluation metrics were outstanding. Keep in mind, this is also disregarding all trading fees, which would obviously decrease the performance of the strategy substantially.
That being said, I just read a scholarly PhD-authored
article published at a university with no reference to the problem I’m outlining that ultimately reached the conclusion: “By utilizing a linear model that takes as input tweets and Google Trends data, we were able to accurately predict the direction of price changes.” [1] Later in the paper, they mention “The study found that logistic regression performed best to classify these tweets and that they were able to correctly predict 43.9% of price increases.” [1] Huh? Did I read that correctly? So what the author here is classifying as ‘accurately predicting’, is losing money 56.1% of the time with no fees considered. Ouch. Further, in Figure 9, the author includes a plot similar to the one I displayed above (that I generated in about 20 minutes), where the predicted price precisely dances along with the actual price so much so that they’re hardly different lines. And, of course, no mention that yesterday’s price is in the feature set.
I would like to make clear that pinning the prediction to a previous price, and then using other features to send the prediction up or down could actually be a useful trading strategy (though, in my opinion, predicting entries and exits directly is a better method than trying to predict the price itself). My main reason for writing this is that I think many people are being deceived by articles like these that do not outline what exactly makes up their training data, but rather try to impress the reader by only including pretty plots and impressive evaluation metrics under the umbrella of a clickbaity title and cover photo.
Conclusion
My ideas regarding this topic are that even though these online articles seem catchy, simple machine learning algorithms are not the best approach to developing trading models. I think there is a place for deep learning here; perhaps large LSTM’s, ConvNets, or other creative NN architectures with technical analysis type features in a reinforcement learning style trading environment may yield productive, profitable results. Ultimately, there are a couple things to keep in mind when researching algorithmic trading and the like:
- If it seems too good to be true, it probably is. Dig a little deeper. Look for a backtest, or backtest it yourself. Profit / loss is a much better evaluation metric than R² or RMSE (See the simple backtesting platform I’ve developed here).
- When people discover profitable algorithms, they generally don’t post them online for the world to see for free. Whenever you make a trade, there is somebody on the other side of it. If you won, they lost. If you lost, they won. Those winners tend not to educate the losers they are benefactors of. That is, of course, unless you are paying them to do so.
All code for this project can be found
here for replication.
Cited:
[1]: Cryptocurrency Price Prediction Using Tweet Volumes and Sentiment Analysis
https://scholar.smu.edu/cgi/viewcontent.cgi?article=1039&context=datasciencereview


")