You are using an out of date browser. It may not display this or other websites correctly.
You should upgrade or use an alternative browser.
You should upgrade or use an alternative browser.
DJI after a FED Meeting
- Thread starter HeSaidSheSaid
- Start date
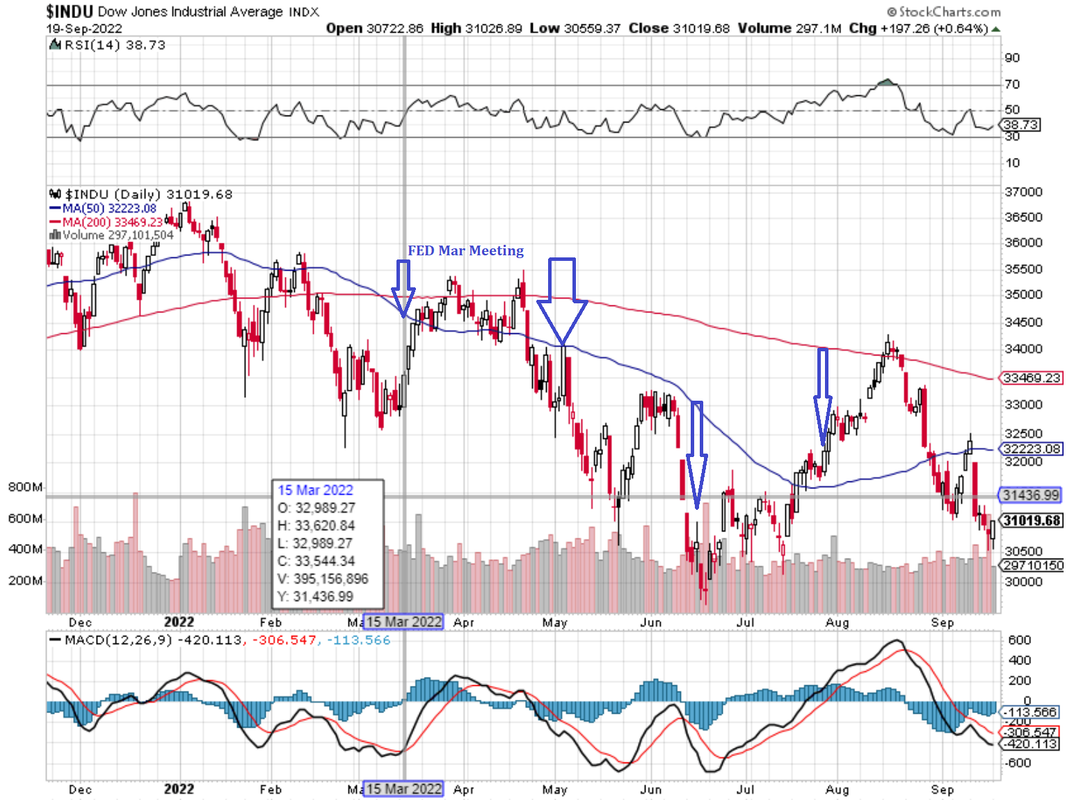

relief rally, NQ up 2% on Wed
%%Posted this $SPX chart a few days ago so it doesn't include yesterday's (or today's so far) daily bar:-
View attachment 295576
Mostly down\trending red chart;
but 50dma upslope is a buy if someone likes a 50 dma........