Yes, thanks for reminding us new traders. I made the same mistake and same delusional thinking when I started writing calls and puts to "generate income", then when the trade went against me, tried rolled out/up.The effect of the initial fly will remain throughout the life of the position, whether you erase individual contracts with adjustments or not. Adjusting is simply adding additional positions to achieve another goal, given a new set of circumstances. The above points are why other posters are trying to force you to think about the initial position and the view it expresses and whether the fly at at the moment you trade it represents some type of edge. Otherwise, you should simply view the initial trade as inheriting someone else's inventory and now you're going to make the best of it going forward.
You are using an out of date browser. It may not display this or other websites correctly.
You should upgrade or use an alternative browser.
You should upgrade or use an alternative browser.
Delta Hedged Put Butterfly - The road to 50% APY
- Thread starter Longshot520
- Start date
I use OptionVue for mine and it models them pretty well, at least as far as I need it to.
Can OptionVue do more than the Analyze Tab in TOS?
Another stupid question for you and OP:
Running through my Excel, the fly outcome still depends on my opinion. 132 seemed to have a better R:R than 121 and lower debit to start, so why not 143, 154 ... flies?
I am not lazy and want an easy answer. I can loop through all the scenarios, but when I do that I can only see the trees instead of the forest.
Best regards,
I never looked at other than 1-2-1 and 1-3-2 fly. Logistically 143, 154 flies are difficult to fill in my opinion. May be better to split the combo into unbalanced 121+ 3x3 credit spread. That will have a better chance to get filled.
Obviously your view of price and vol outlook effects your p/l.
Just as an example, I set-up 3 fly's with 3 weeks to go with similar delta's around -120. I will take off the fly some time in the middle around 3/13/2019
1) Regular Bfly (top right) 2725-2800-2875. (8 count). Debit $32.5k
2) 132 Fly (bottom left) 2725-2825-2875 (10 count). Debit $34.5k
3) 154 fly (bottom right) 2725-2825-2850 (6 count). Debit $26k
Assuming my assumption of price and vol remains where it is, 132 is better from %ge profit and total $ perspective. P&L is shown in the green right next to "Now" on each graph. 132 has slightly higher breakeven and 154 has slightly lower breakeven (expected since you sold more credit spread upside). Long story short you are not gaining much from 154 fly. 132 is kind of sweet spot.
Last edited:
2) 132 Fly (bottom left) 2725-2825-2875 (10 count). Debit $34.5k
Now isn't the max loss = debit of 34.5k?
The diagram shows it below 40k.
Now isn't the max loss = debit of 34.5k?
The diagram shows it below 40k.
Good catch. Too late to edit my post. I accidentally used expiration profit as denominator. Debit numbers are as follows.
1) Bfly $24.6k
2) 132 Debit $43.9k and 3) 154 fly debit $21.1k
That changes my analysis. Regular Bfly is slightly better when the price and vol stays the same and offers slightly more downside protection. But I am not sure it is fair comparison with 132, since short strike is higher compared regular Bfly.
There is no advantage with 154 vs 132 other than more commissions and complicated setup.
Then you have to answer a few questions first:I am not lazy and want an easy answer.
- What is your motivation/view that you are trying to express?
- Are you holding it to expiration or going to exit at a predetermined setup/time?
Can OptionVue do more than the Analyze Tab in TOS?
Eh, not for what I'm using it for. I tried the TOS analyze tab, and the OptionVue setup just felt a lot cleaner. OptionVue also insists it uses a more accurate model of analysis to make the greeks more precise.
The other thing I like is you can visually analyze the ENTIRE position of any asset class. For example, you can see the Srinir has 3 different flies with 3 different charts. OptionVue will combine all 3 to give you the total position greeks and visual analysis. I do really like that.
Which model you are using in OptionVue (Variable, New variable, EIEIO)? I also have OV and a long time user not sure I accept their greeks are better. Their Var, New Var models are very optimistic, In down move relying on their greeks is not a very good idea. EIEIO model is same as TOS and atleast have realistic greeks.
TOS also can combine positions and can give total position greeks. Where OV excels is overlaying two positions one above the other and backtesting. Overlaing of two positions cannot be done is TOS. Backtesting can be done in TOS, but not very easy.
Main problem with OV is it is just analyzing software. It is not connected to broker seamlessly. Mistakes bound to happen during transfer of positions. Also, If you have lot of trades, every-time you make a trade or adjust entering or transferring can be a chore.
The model suggested to me was the NewVar. Can you expand a bit on why this model would suffer in a large down move?
Agreed about the lack of a seamless transition from OV to broker, it's not even worth my time to use. Luckily, I don't anticipate having to make too many trades, ideally no more than 3-5 adjustments per fly over a 30-45 day time frame, if not less.
I typically check my position around 2:00 CST every day, about an hour before market closes. I chose this time because it usually has allowed whatever agenda Mr. Market has for the day to play out, but gives me enough time to make adjustments and not get hosed on price. Today looks nice and boring, just like I like it. Even on a big swing day where we had an almost 2% drop from the high, position just chilled, no worries.
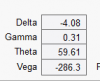
Greeks look good, position is slightly profitable:

Analyze graph (t+0) looks good:

Greeks look good, position is slightly profitable:
Analyze graph (t+0) looks good: