Deciding when to take profits (I let most of my winners turn into losers)

Quote from IronFist:

Oh speaking of tick charts, I can get them on OEC's platform but then I lose my ability to scroll to the left and see historic data. So for example right now I'm looking at tick charts with 300 ticks per candle (arbitrary number I just picked) and my chart is starting around 7:57am and I can't scroll to the left anymore than that.

Don't set tick to a tick chart. It doesn't move frequently so you'll end up with 5 candles after a day and it won't be useful. Tick charts are nice in high volume stocks to see movement. But not for indicators. Just set the tick to 5 minutes. You want to see the market sentiment for a certain period of time.

Check out this blog for more explanations of how to use the nyse tick for intrday trading

www.traderfeed.blogspot.com/
 
Quote from ssbc19:

Here you go
https://trading.scottrade.com/TouchToneGuide/Available_Indicators.htm

nyse tick is "ntick", nasdaq tick is "qtick"

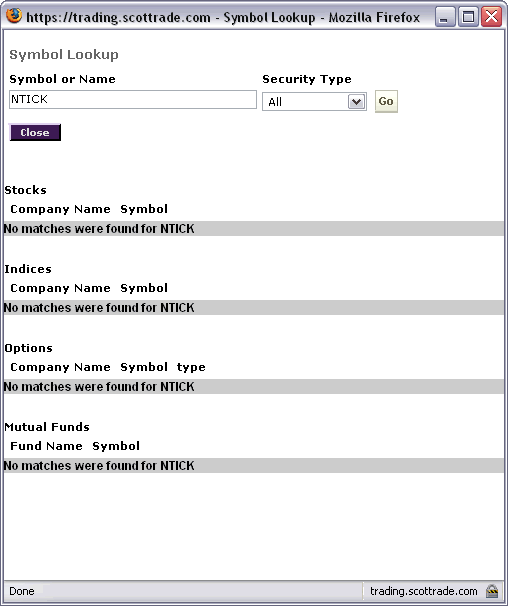
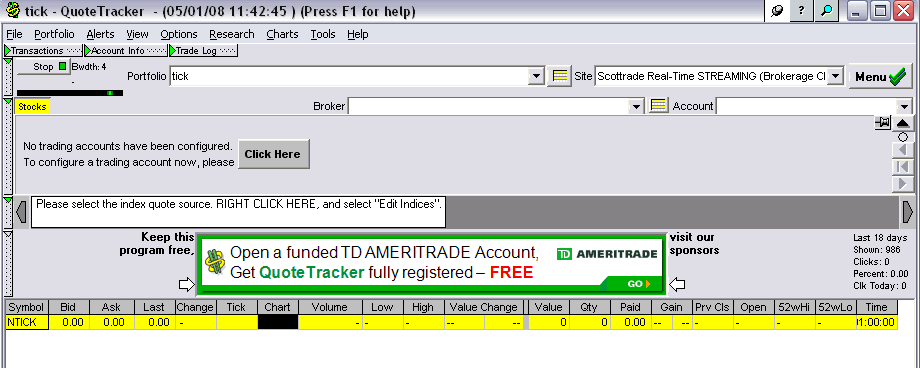
What am I doing wrong?

nontick1.gif


nontick2.gif


I'm gonna feel like a huge idiot if I'm overlooking something obvious here. Oh wait, that list you posted is for IVR (Phone). Are these symbols available over the web?


Those are good measure of market sentiment. For the most part ntick should work well for YM and qtick for NQ.

There is also TIKI. That is the up/down tick ratio of the Dow 30, which comprise YM.

You can see on both the tick and the tiki that around 12am EST there was a less selling.

TIKI lows went from around 25 to between 15 and 20. And for almost an hour TICK couldn't even go into the negative. And in that both had higher highs and there was a huge rally.

Omg there was a huge rally today. I would've been up $800 on one contract of NQ had I actually been at my computer this morning :)
 
Quote from IronFist:


Any (free) charting software I should download that is compatible with OEC's demo feed that doesn't have this limitation?

IronFirst, you started this thread in a good direction. Which was, how to improve a SIMPLE system.

Now you're making the very typical newbie mistake of listening to a lot of crap that is pushing you into the weeds with detail you don't need.

I'll give you one example. Your system is to go long when price is above the 60EMA, and short when price is below the same EMA.

I don't believe you mentioned the periodicity you are testing/trading, but I'm going to assume one minute bars.

The following are the results of a 6 month backtest on ES, specifically using your entry specs. Nothing has been added to the entry. I assumed 3 contracts short and long.

I have simply entered at a specific time of day, exited at the day close, and used a stop of .0065%. (I won't reveal the time of entry, because I use it in my own trading, as I do with a few other specific times for entry.)

Here are the results. Again, with your simple entry.

Gross profit $33,855.58
Maximum Drawdown $1,440.00
Commissions $2,380.00
Average Drawdown $738.15
Net Profit $31,475.58
Avg Profit/Trade $264.50
Avg % Gain/Trade 8.817%
Avg % Gain/Bar 0.188%
Ratio Avg Win/Avg Loss 1.21
Total # Of Trades 119
Percent Profitable 57%
Winning Trades 69
Losing Trades 50
Largest Winning Trade $6,430.00
Largest Losing Trade $1,592.09
Average Winning Trade $1,140.87
Average Losing Trade $944.89
Largest Winning Long $6,430.00
Largest Losing Long $1,592.09
Largest Winning Short $3,220.00
Largest Losing Short $1,566.16
Number Periods Long 2806
Percent Periods Long 2.68%
Number Periods Short 2768
Percent Periods Short 2.64%
Max Consec. Winners 8
Max Consec. Losers 5

Now, is this a 'great' system? No, but it is a very solid system to build on, and a good beginning. You need only to continue to make adjustments and look at it from various angles.

The reason I am posting this is to make the simple but important point that further complicating your system is not the way to go. The best systems I trade are mechanical, and based only on price. Nothing else.

You are already on generally the right path.

Tick, trin, CCI, inversions, perversions, whatever...all completely unnecessary for success. Keep it simple, simple, simple.

 
Quote from lindq:

I have simply entered at a specific time of day, exited at the day close, and used a stop of .0065%. (I won't reveal the time of entry,
[/B]

Hi lindq,

.0065% of what? ADR?

And what is so secret about the time of day you enter?

~Mike
 
Quote from lindq:

Nice clock! And I've noticed how much IronFist appreciates the help. Typical.

Maybe he simply is away from his computer, but I can assure you that there are others who appreciate the work you've done to analyze a simple system that has potential. And I am one of them.

Thanks.
 
Hi nkhoi,

Should this this clock be taken seriously?

Many people day trade the first hour. According to this clock, 1/2 of their time is red :))
 
Quote from IronFist:

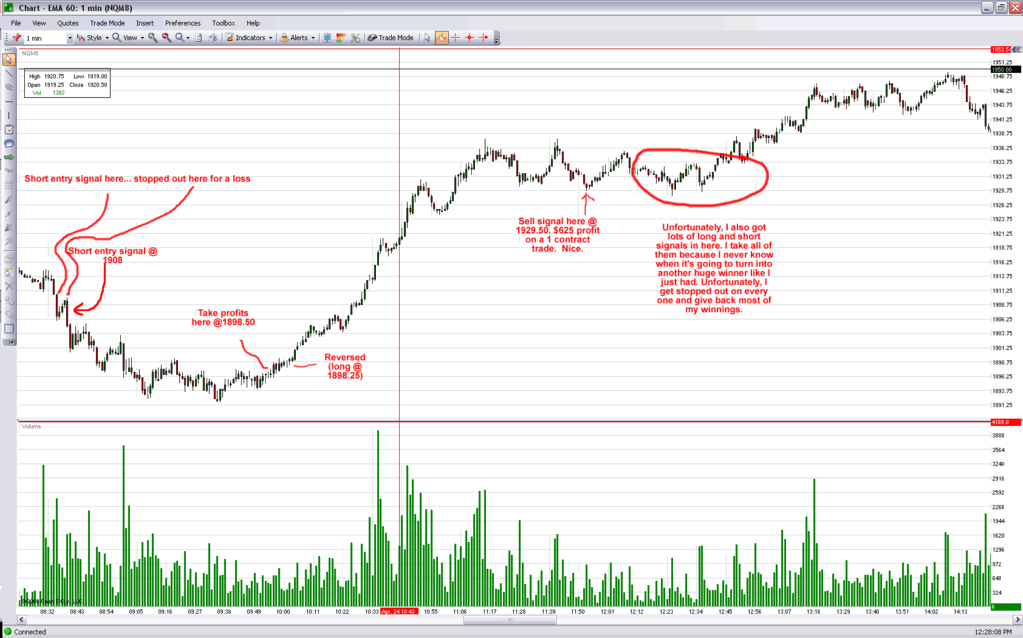
The other day:

fail1.gif


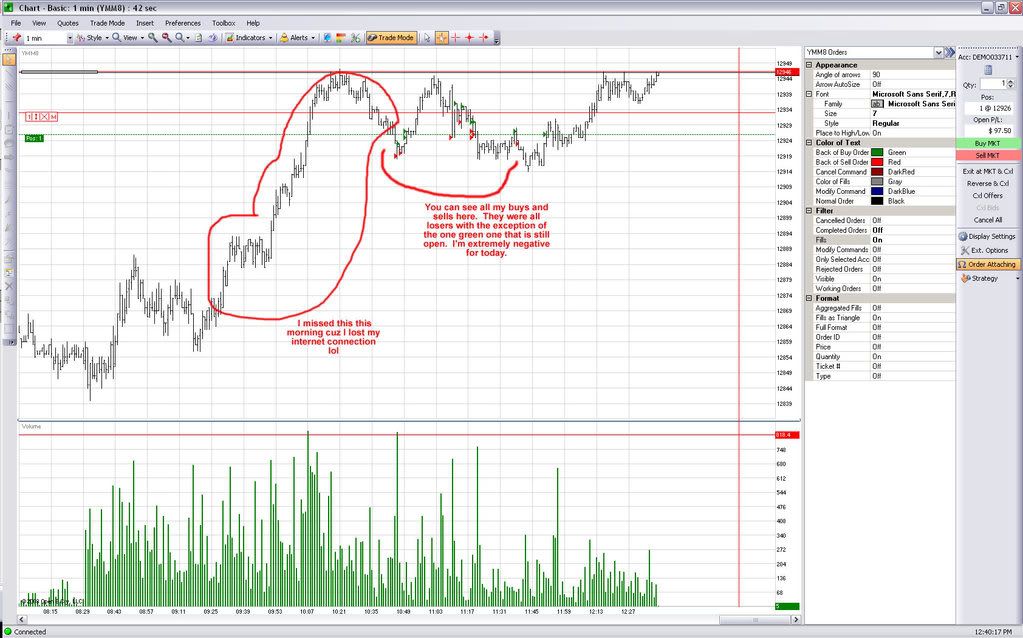
Today so far:

fail2.jpg

Use trendlines and identify price action ( I drew some lines in for u) Secondly--1 minute charts are way too whippy --try at least a 3 min.
<a href="http://tinypic.com" target="_blank"><img src="http://i29.tinypic.com/166jbs9.png" border="0" alt="Image and video hosting by TinyPic"></a>
 
Quote from nimble:

Hi nkhoi,

Should this this clock be taken seriously?

Many people day trade the first hour. According to this clock, 1/2 of their time is red :))
it's for a beginner as he will quickly find himself in red in the red zone.
 
Back
Top