Quote from horton:
cascade - are you able to import fundamental data series into amibroker or just the current fundamental snapshot from Yahoo. Also, if you are importing fundamental data series, does the series have to be associated with a ticker? For example, can you import economic data series and chart them individually or against a ticker, sector, etc.?
At the moment, it is only current fundamental data. But depending on what you're trying to do, you can get around it if you're smart.
So for example; if I'm looking to try and get 2008 EPS figures into Amibroker, then what I would do is import that into amibroker using the import wizard by creating a csv file, and putting that into the place of the "eps" field of data. so instead of the yahoo data that's in there, what you now have is the 2008 eps figure that you imported in there.
I do this regularly for prior years eps figure for all 8000 stocks on the us markets, but usually put it in the place of the "Forward EPS" field ... so that way I have prior eps figures as well as current (from yahoo). All you need is a data set in a csv file to import.
--> i usually shove nominated eps figures in the "forward eps" field in amibroker:
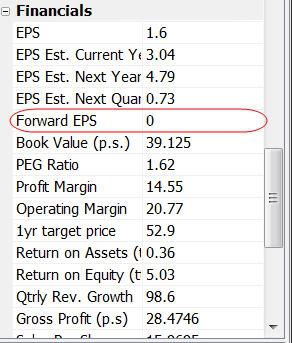
Then what you could do is take that customized "forward eps" data field (which is 2008 eps for the example I have used) and chart it. So say I wanted to chart next year's eps figure; i.e. 2010 eps vs. 2008 eps ... I could do that, with the example above.
In fact, you can throw any sort of data you want in any field. You could even get prior year's P/E ratio in that forward eps field or any other field you wish ... so long as you have the data set. Getting the data is the hard part ... I usually get it from my broker, and turn it into a csv file.
I usually just throw data into the forward eps field for Amibroker b/c when you download data from yahoo, yahoo usually doesn't use that field or the data is always '0' ... meaning yahoo has no data there.
You don't really need yahoo data if you have your own. You could get all your data from a data provider or a broker, and then import it in ... but it might cost you. But at the moment yahoo is the most efficient place to get free fundamental data.
However for very detailed historical data like whole financial statements (like balance sheets, income statements etc) ... AB can't do that, and is not designed for that. Amibroker best for key ratios and eps figures.
with regards to macro data, you can create synthetic tickers to chart economic data series. Here's an example of what I have done,
Australian Govt. 10 year bond yields for the past 15 years:
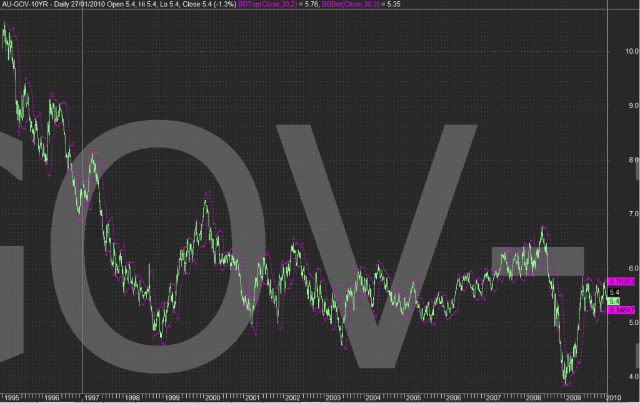
I even have bollinger bands on the 10 year bond yields .... ftw!!
My ticker code for the bond yield data is "AU-GOV-10YR" ... as you can see on the top left hand corner of the image.
Here is a chart with the above data, as well as Citigroup stock price overlayed:
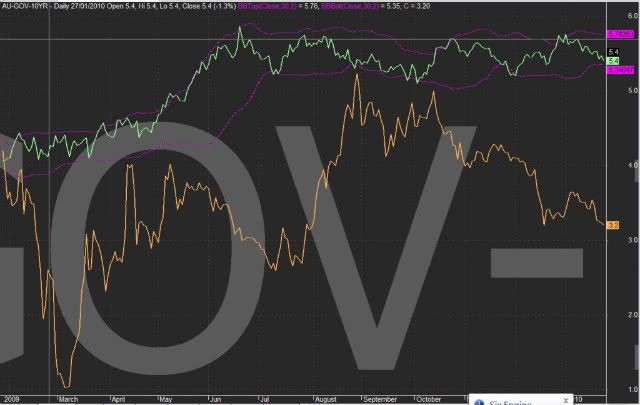
I'm not sure why you would ever chart the Australian 10 year govt bond yields + Citigroup + Bollinger Bands .... lol ... but hey ... just shows you what you can do with AB charts.
Cheers.
") I shall check the points with TradersStudio and let you know.
I shall check the points with TradersStudio and let you know.