Ok here's my performance on the YM today.
Chart:
YMM8
500 constant volume OHLC bars
Slow MA = 240WMA colored according to slope
Fast MA = 6WMA colored according to slope
(there's also a 17HMA colored according to slope, purple = down and yellow = up).
Trades placed according to the 6WMA. OHLC bars are also color coded according to the slope of the 6WMA. So green bar = 6WMA sloping up, and red bar = 6WMA sloping down.
Entry criteria = after a higher high and higher low, I enter on the completion of the first green candle (and therefore a sloping up 6WMA since that's how the candles are colored). And vice versa for shorts.
Exit criteria = A few ticks profit or stoploss set 1 tick under previous low (or 1 tick over previous high for short positions)
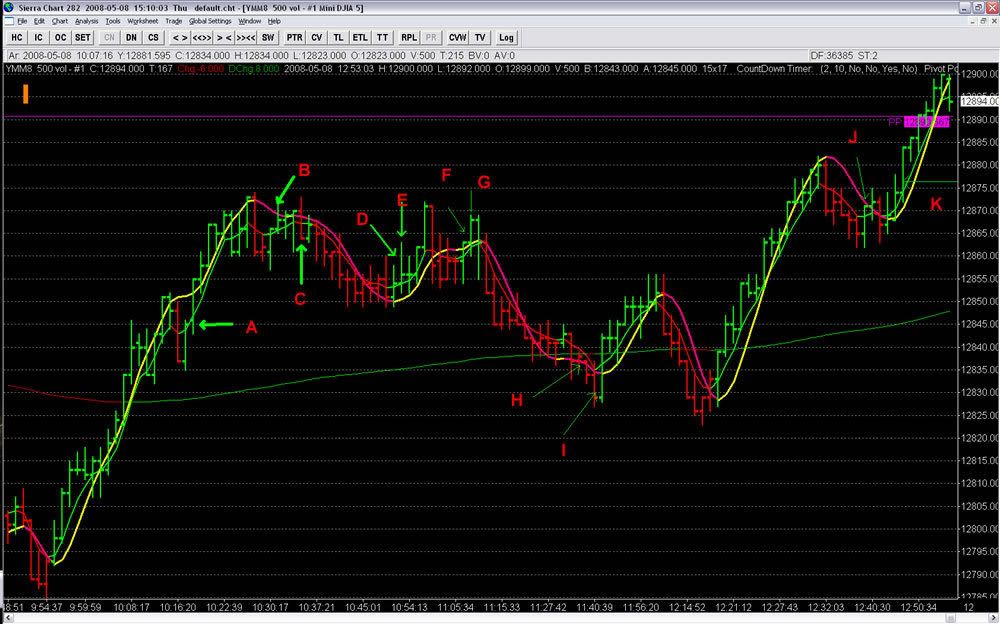
FIRST HALF OF DAY:
A
Slow MA sloping up, price above.
Fast MA sloped down for one candle and made a new, higher low, and then resume up. I entered at the start of the second green candle (first green candle was confirmation of uptrend)
Buy= 12845
I exited a few ticks later at 12849. I'm not used to scalping
at all so I wasn't sure how long to wait.
+4 ticks
B
A new lower low was just made. I entered at the beginning of the first candle after the first green candle (got a little slippage tho).
Buy = 12869
C
Sell = 12862 (when the first red candle completed; short term trend no longer up)
- 7 ticks
D
Thinking that maybe I need to use a bigger scale, I entered here at 12858 after the 6WMA started to slope up again. I was considering the previous group of red candles to be the "higher low" following the red candles at the beginning of my chart.
Buy = 12858
E
Exit after a few ticks profit, trying to scalp.
Sell = 12861
+3
F
The preceding red candles were a higher low, so I entered when Fast MA sloped back up.
Buy = 12865
G
Exit after a few ticks (luckily at the top!)
Sell = 12867
+ 2
H
Price is now below Slow MA. A lower high was formed by one candle right above the Slow MA. I entered at H as soon as the Fast MA turned down again.
Short = 12836
I
Trying to scalp a few ticks (lucky exit at the bottom)
Cover = 12829
+ 7
J
Price above slow MA, higher low formed, enter at J on after completion of first upward sloping Fast MA candle.
Buy = 12871
K
Scalping for a few ticks. Had no idea this was going to be a HUGE uptrend. Missed getting stopped out by 2 ticks.
Sell = 12876
+5
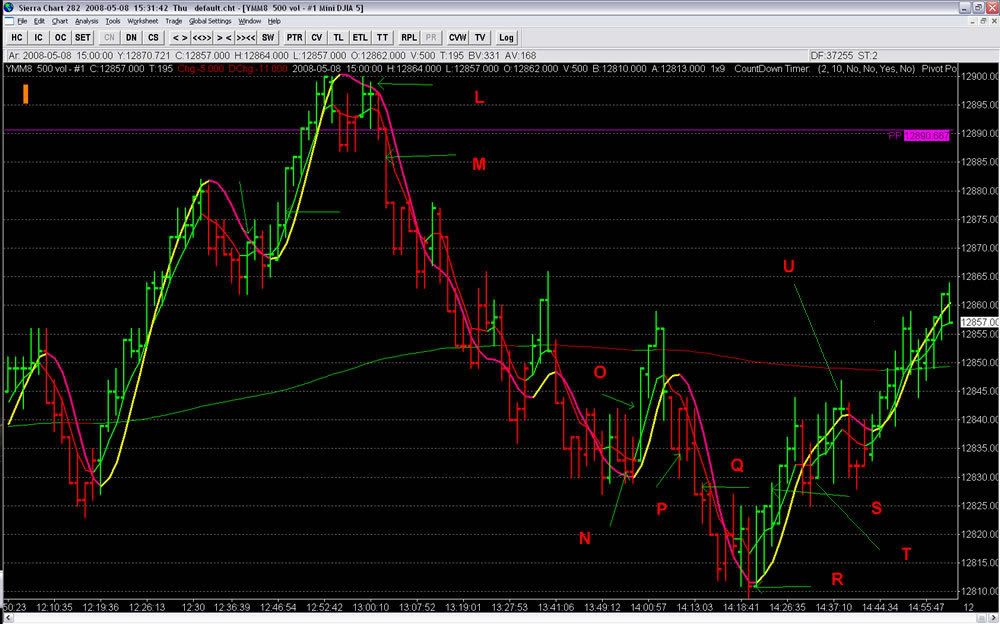
SECOND HALF OF DAY
L
Higher low, enter when new green candle is formed.
Buy = 12898
M
Stop hit at 1 tick under previous low.
Sell = 12886
-12
N
Lower high (previous green candle), enter short on completion of red candle.
Sell = 12831
O
Stop hit at 1 tick above previous high.
Cover = 12844
- 13
P
Looking at my chart I'm not sure why I entered here. In fact, I shouldn't have, because the previous high was a higher high. Oops.
Sell = 12834
Q
Covering the position I'm not even sure why I entered.
Cover = 12828
+3 (but this shouldn't count cuz I shouldn't have entered this trade)
R
Lower high (one green candle before). Enter at completion of new red candle (downward fast MA)
Sell = 12811
S
Stopped out at 1 tick above previous high
Cover = 12828
-17
T
Thinking maybe that previous lower high (the one green candle) wasn't correct, I considered that the last time the price was above the 240WMA to be the last "hight" and then the run of green candles that just formed to be the "real" "lower high." This is obvious if you look at the chart. Sell short at completion of first red candle (downtrend resuming)
Sell = 18262
U
Stopped out 1 tick above prevoius high
Cover = 18245
- 19
Total for day = -44 ticks
Thoughts: Using 1 tick above the previous high resulted in catastrophic failure when my stops were hit on my short positions. Without a 90% win rate I will need to come up with a better stoploss plan.