Here are some things I've been thinking about:
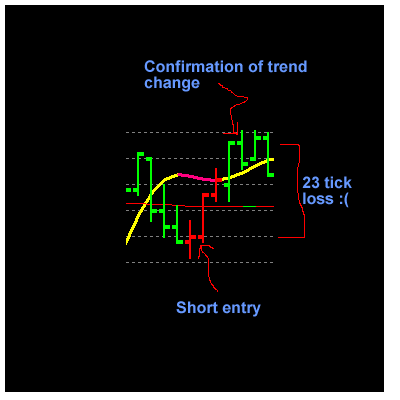
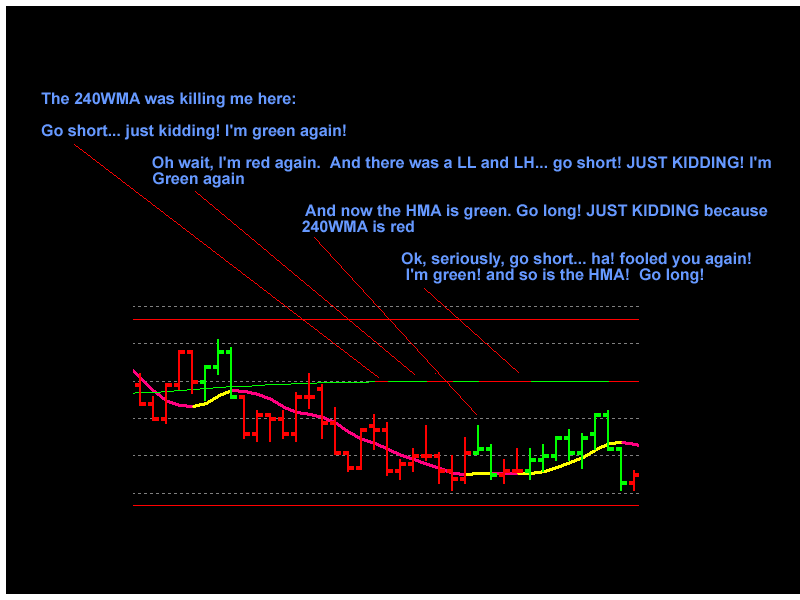
I am getting hurt here in choppy areas. Take this for example:
(in all pics here the thin line is 240WMA and the thicker line is 17HMA. The candles are colored according to the slope of the HMA, I just left the actual HMA visible so I could see its angle)
240wma sloping down
17HMA just changed to down slope, wait for confirmation (close of first red candle, enter short)
There was no scalping opportunity and if you held onto this trade until confirmation of the HMA changing slope, you ate a 23 tick loss.
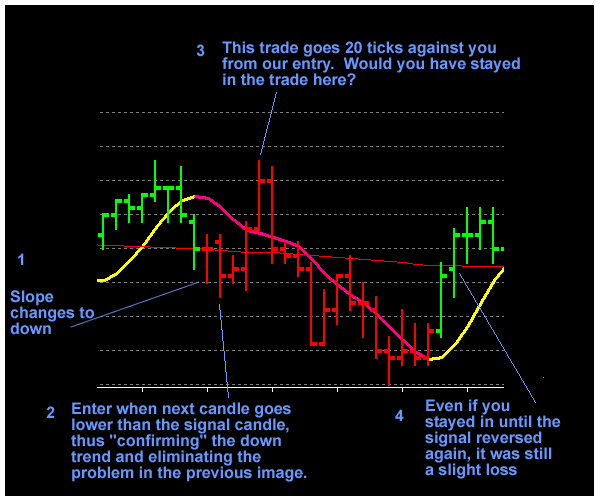
So looking at that chart, what seemed like an obvious modification to that entry strategy was to not enter
until the second candle breaks the low of the first (for a short position) thus "confirming" the downtrend. That would have caused us to not even take that trade which would have increased our P/L statement by eliminating a losing trade.
But then I realized that that wasn't a reliable strategy, either, because sometimes even when it looks like it's going to be a down trend, and the second candle goes lower than the low of the first (for a short position), it then reverses:
Of course, simply entering when the second candle of the new color appears works a lot of the time, too. But I'm still trying to come up with an algorithm to improve the results and more importantly
not enter when it's just going to reverse right away.
I figure reducing losses is more important than increasing winners.
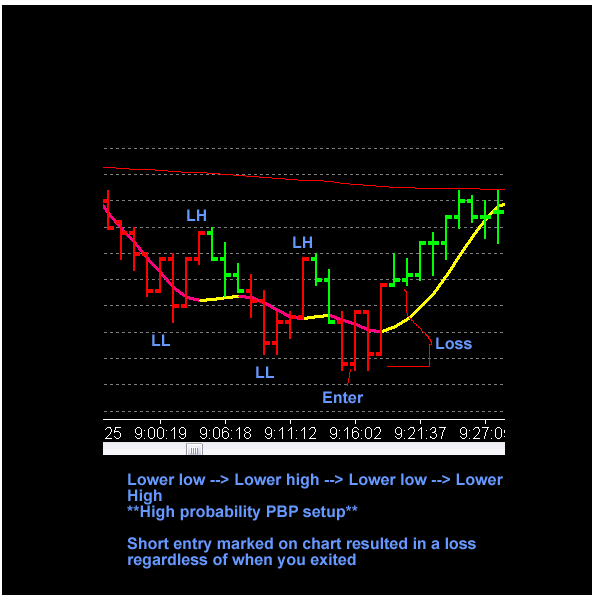
Sometimes the above situation occurs even with a perfect PBP setup. You enter after lower lows and lower highs and it still goes against you immediately:
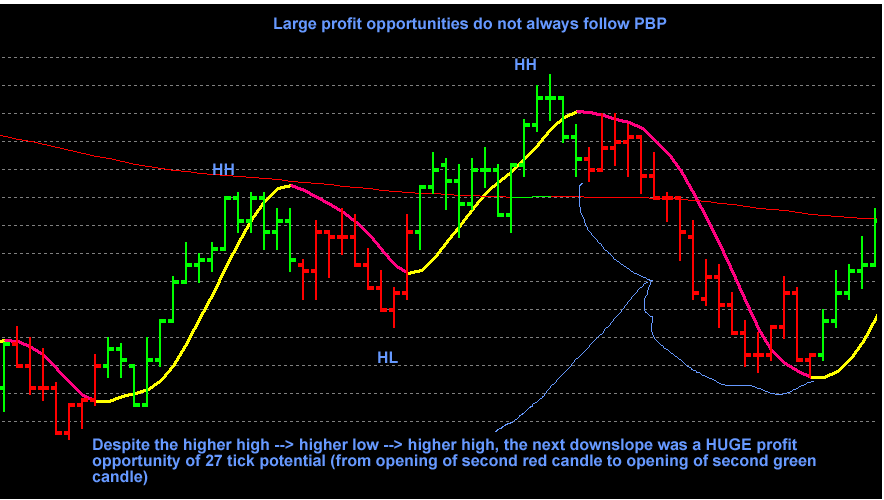
And sometimes the opposite occurs, and you get huge profit opportunities that don't follow PBP:
^ This picture also illustrates why you can't use a stop
above the high of the first red candle for a short trade.
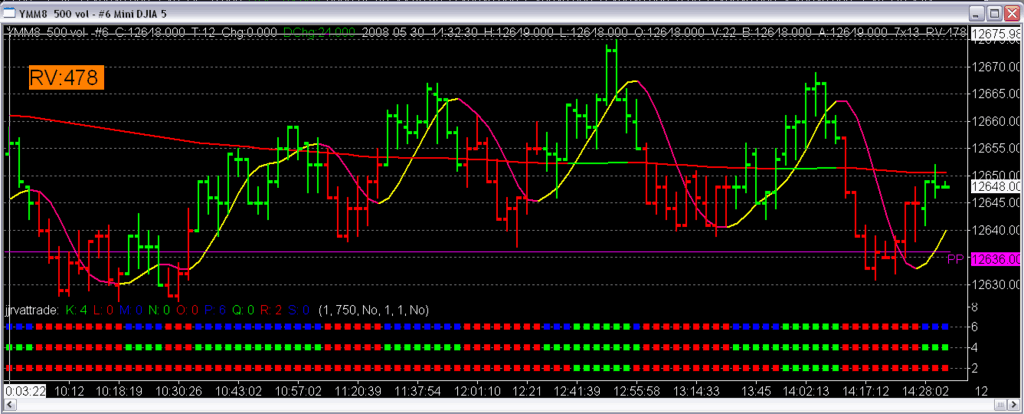
And sometimes the 240WMA can't make up its mind about what it wants to do. This is the YM from the last hour of trading yesterday (5/31/08 2-3pm CST). I got destroyed and had 5 losses in a row (my new record)
And finally, even this afternoon I've been getting chopped to hell.
I borrowed the idea from the charts that TheRumpledOne was posting and made my own jjrvat indicator (except mine isn't as pretty). It's 3 rows of dots.
The bottom row is the slope of the 240WMA (red = down, green = up, blue = horizontal (uncommon))
The middle row is the HMA (same color/slope coding)
The top row is the jjrvat trade indicator. If both slopes are down, it turns red (go short). If both slopes are up, it turns green (go long). If they don't match, it is blue (meaning don't take any action).
Of course the problem is that the dots can change color at any point during a candle's formation, so I can never enter until the SECOND dot of a given color on the top row.
Anyway, here's this afternoon and you can see from this chart where all my long and short entries were (top row of the indicator, enter short on second red dot in a row, enter long on second green dot in a row for the reasons explained in the previous paragraph.
So my priorities are:
1. Come up with a better entry system to help me avoid trades where it's going to reverse right away (such as in the first image).
2. Come up with a better exit system because:
...a) I suck at scalping
...b) waiting until confirmation of the HMA changing slope for an exit often leads to large losses
...c) with my mentality I need everything to be 100% mechanical. No discretion, no emotion.