Ninja Mobile Trader VPS
Sponsor
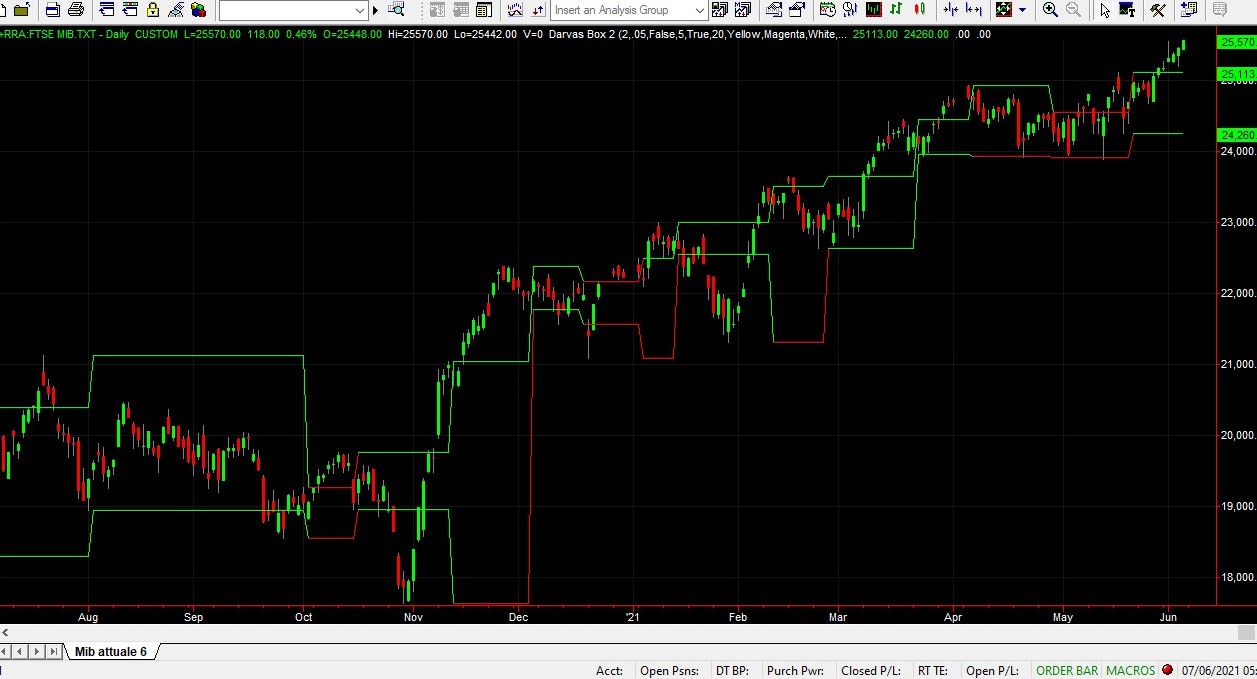
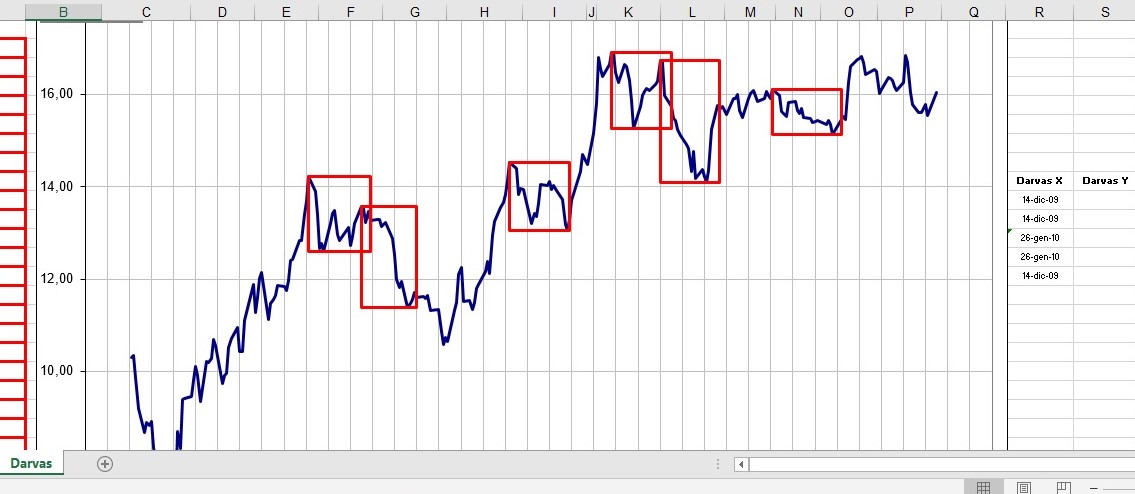
Here is the formula in Easylanguage of an Indicator inspired by Nicolas Darvas' technique, which plots supports and resistances:
https://www.mediafire.com/file/mekvo0lp0i01jnj/Darvas_Box.rar/file
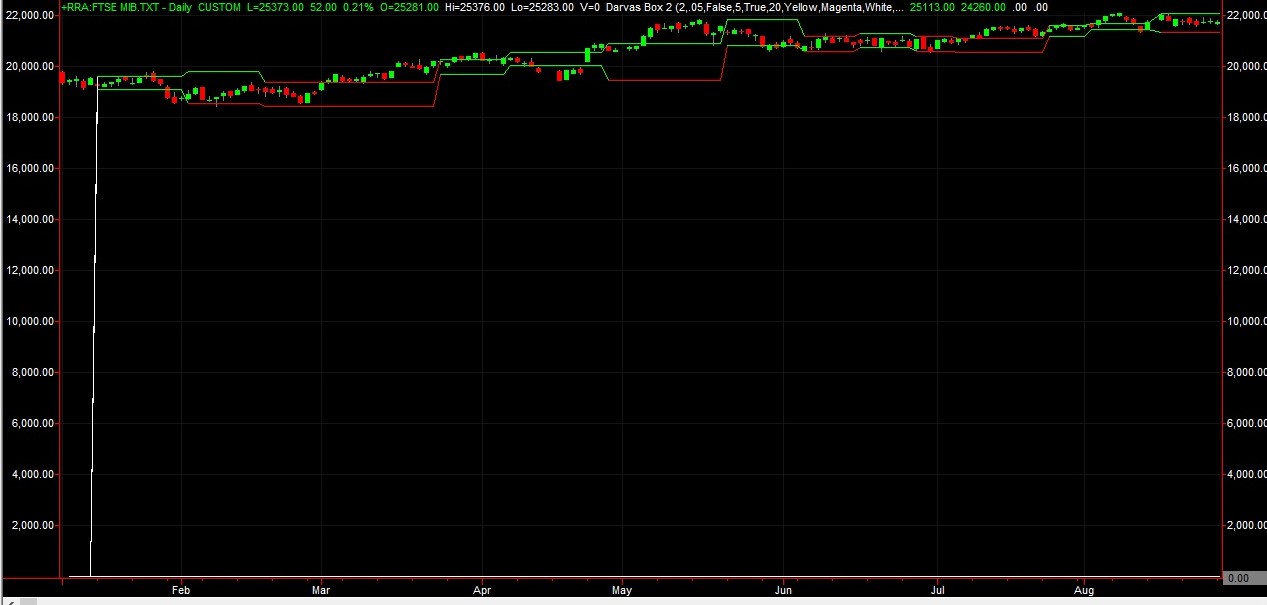
but when I insert it in the chart, the image becomes very narrow, if someone can solve this problem:
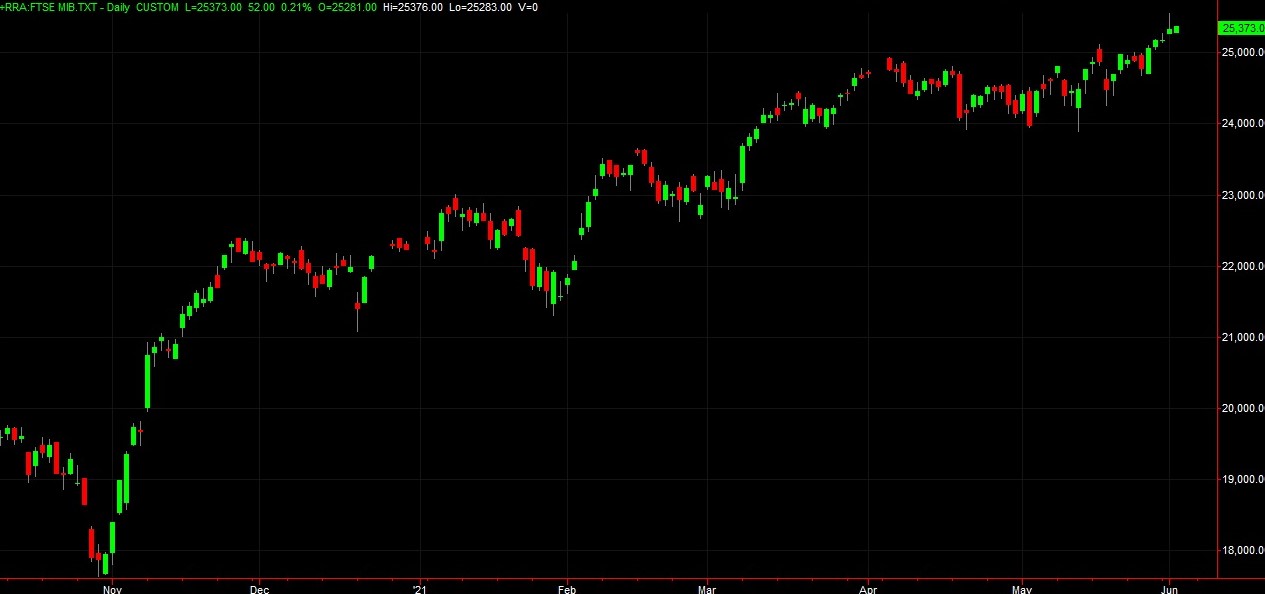
before inserting the indicator, the chart has these dimensions:
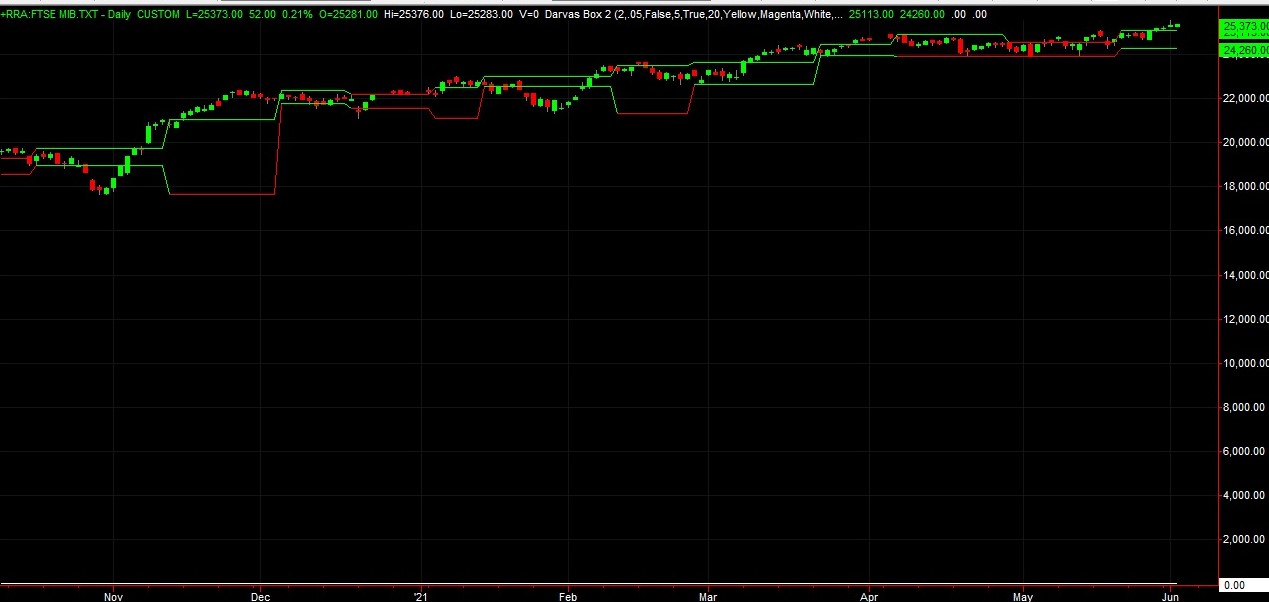
It looks like it is plotting a value at 0. Can you remove whatever this plot is, either from code or visually from the graph?