Daily Forex Quantitative Trading Ideas And Analysis

Highlights going into Friday, 8 June-

Short-term momentum changes:

Positive - $EURCAD $GBPCAD

Negative - $AUDCHF $NZDCHF


Long-term momentum changes:

Positive - none

Negative - none


Structure changes:

Positive - none

Negative - none

Daily price ranges have compressed significantly for $NZDCAD and $NZDUSD.

3-day price ranges have compressed significantly for $NZDJPY and $USDJPY

Compressed ranges are anticipated to expand relatively soon.

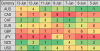
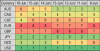
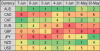
The image with this post ranks short-term momentum for the majors. The strongest momentum is ranked "1" in dark green and "8" is the weakest or most negative. This gives you a visual representation of strength and weakness to construct trades with corresponding pairs and crosses that represent buying strength and selling weakness. The most opportunistic trades tend to be when there is a shift in trend moving toward the top or bottom of the momentum ranks.

Make it a great day!
 

Attachments

  • fx daily st mom rank 8 June.png
    fx daily st mom rank 8 June.png
    161.9 KB · Views: 14
Highlights going into Monday, 11 June-


Short-term momentum changes:

Positive - none

Negative - $AUDNZD $CADJPY


Long-term momentum changes:

Positive - none

Negative - none


Structure changes:

Positive - $GBPAUD $EURAUD

Negative - $AUDJPY $AUDUSD $CADJPY $NZDJPY


Daily price range has compressed significantly for $EURUSD

3-day price range has compressed significantly for $GBPNZD and $NZDUSD

Compressed ranges are anticipated to expand relatively soon.


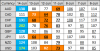
The image with this post is a 30-day correlation matrix. Several pairs have recently been highly correlated and inversely correlated. High correlations are highlighted in green. High inverse correlations are highlighted in red. Lack of correlation is highlighted in yellow.


Make it a great day !
 

Attachments

  • fx 30 day corr 06112018.png
    fx 30 day corr 06112018.png
    403.8 KB · Views: 15
Highlights going into Tuesday, 12 June-

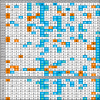
Volatility has largely swung from extreme highs to extreme lows (see image with this post for a visual representation.

Of note - AUD, USD, $AUDUSD, $EURUSD, $GBPNZD, and $NZDUSD, are anticipated to breakout relatively soon.

Short-term momentum changes:

Positive - $AUDCHF

Negative - none

Long-term momentum changes:

Positive - none

Negative - none

Additionally, there are no structure changes for today.

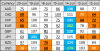
The image with this post highlights the daily range as a percentage of the normalized typical range for the 28 pairs and 8 major currencies we follow. Values shaded in blue exceed 1 standard deviation above typical range. Values shaded in orange exceed 1 standard deviation below typical range. Values highlighted in yellow exceed 2 standard deviations above or below typical range. Bold black values are highest or lowest of at least 20 days. Underlined values are lower than prior day.

Make it a great day!
 

Attachments

  • FX RPM 12 june.png
    FX RPM 12 june.png
    868.6 KB · Views: 11
Highlights going into Wednesday, 13 June-

Volatility has largely swung from extreme highs to extreme lows (see image with this post for a visual representation)

Of note - $AUDJPY $EURJPY $GBPJPY and $USDCAD have experienced compressed ranges and are poised to breakout relatively soon.

Short-term momentum changes:

Positive - none

Negative - $EURUSD

Long-term momentum changes:

Positive - none

Negative - none


Structure changes:

Positive - $NZDJPY

Negative - none

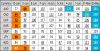
The image with this post highlights the daily range as a percentage of the normalized typical range for the 8 major currencies we follow. Values shaded in blue exceed 1 standard deviation above typical range. Values shaded in orange exceed 1 standard deviation below typical range. Values highlighted in yellow exceed 2 standard deviations above or below typical range. Bold black values are highest or lowest of at least 20 days. Underlined values are lower than prior day.


Make it a great day!
 

Attachments

  • FX RPM 13 june.png
    FX RPM 13 june.png
    234.4 KB · Views: 11
Highlights going into Thursday, 14 June-

Volatility generally remains compressed and is increasingly more likely to expand relatively soon.

Specifically, price ranges have compressed significantly for $CADJPY $EURCAD $CADCHF $EURCHF $GBPCAD

Short-term momentum changes:

Positive - $CADJPY

Negative - $AUDUSD

Long-term momentum changes:

Positive - none

Negative - none


Structure changes:

Positive - $CADJPY

Negative - none


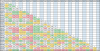
The image with this post ranks short-term momentum for the majors. The strongest momentum is ranked "1" in dark green and "8" is the weakest or most negative. This gives you a visual representation of strength and weakness to construct trades with corresponding pairs and crosses that represent buying strength and selling weakness. The most opportunistic trades tend to be when there is a shift in trend moving toward the top or bottom of the momentum ranks.


Make it a great day!
 

Attachments

  • fx daily st mom rank 14 June.png
    fx daily st mom rank 14 June.png
    153 KB · Views: 10
Highlights going into Friday, 15 June-

As anticipated and mentioned in yesterday's update, volatility has broken out after being significantly compressed (see image for a visual representation.)


Short-term momentum changes:

Positive - $NZDCHF $USDCHF

Negative - $AUDCAD $AUDCHF $AUDJPY $EURCAD $EURGBP $EURJPY, $NZDUSD

Long-term momentum changes:

Positive - none

Negative - $AUDNZD $EURGBP


The image with this post highlights the daily range as a percentage of the normalized typical range for the 8 major currencies we follow. Values shaded in blue exceed 1 standard deviation above typical range. Values shaded in orange exceed 1 standard deviation below typical range. Values highlighted in yellow exceed 2 standard deviations above or below typical range. Bold black values are highest or lowest of at least 20 days. Underlined values are lower than prior day.

Make it a great day!
 

Attachments

  • FX RPM 15 june.png
    FX RPM 15 june.png
    213.8 KB · Views: 10
Highlights going into Tuesday, 19 June-


Short-term momentum changes:

Positive - $EURAUD $EURCAD

Negative - $NZDCHF $NZDJPY


Long-term momentum changes:

Positive - none

Negative - $AUDCHF $AUDNZD $CADCHF


Daily price ranges have compressed significantly for $GBPUSD and $NZDUSD.

Compressed ranges are anticipated to expand relatively soon.

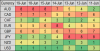
The image with this post ranks long-term momentum for the majors. The strongest momentum is ranked "1" in dark green and "8" is the weakest or most negative. This gives you a visual representation of strength and weakness to construct trades with corresponding pairs and crosses that represent buying strength and selling weakness. The most opportunistic trades tend to be when there is a shift in trend moving toward the top or bottom of the momentum ranking.


Make it a great day!
 

Attachments

  • fx daily lt mom rank 19 June.png
    fx daily lt mom rank 19 June.png
    143.5 KB · Views: 10
Highlights going into Wednesday, 20 June-


Short-term momentum changes:

Positive - $EURGBP

Negative - $CHFJPY


Long-term momentum changes:

Positive - $GBPAUD

Negative - none


Price structure has turned negative for $AUDCAD and $EURCHF


Yesterday the image shared was of the majors long-term momentum ranking. Today, the image with this post illustrates short-term momentum for the majors. The strongest momentum is ranked "1" in dark green and "8" is the weakest or most negative. This gives you a visual representation of strength and weakness to construct trades with corresponding pairs and crosses that represent buying strength and selling weakness. The most opportunistic trades tend to be when there is a shift in trend moving toward the top or bottom of the momentum ranking.


Make it a great day!
 

Attachments

  • fx daily st mom rank 20 June.png
    fx daily st mom rank 20 June.png
    157.2 KB · Views: 11
Highlights going into Thursday, 21 June-

Volatility has cycled back to relatively low levels (see image for details.)

Daily price ranges have compressed significantly for $CADJPY $EURCAD $EURGBP and 3-day price ranges for $CHFJPY $NZDCAD and $USDCHF

Compressed ranges are anticipated to expand relatively soon.

The image with this post highlights the daily range as a percentage of the normalized typical range for the 8 major currencies we follow. Values shaded in blue exceed 1 standard deviation above typical range. Values shaded in orange exceed 1 standard deviation below typical range. Values highlighted in yellow exceed 2 standard deviations above or below typical range. Bold black values are highest or lowest of at least 20 days. Underlined values are lower than prior day.


Make it a great day!
 

Attachments

  • FX RPM 21 june.png
    FX RPM 21 june.png
    212.4 KB · Views: 11
I am thankful to the forum elitetrader for providing us such an amazing information, analysis, and predictions as well. I trust the stats presented here as they are viable and taken from good sources. You people can also do the same. Thank you!
 
Back
Top